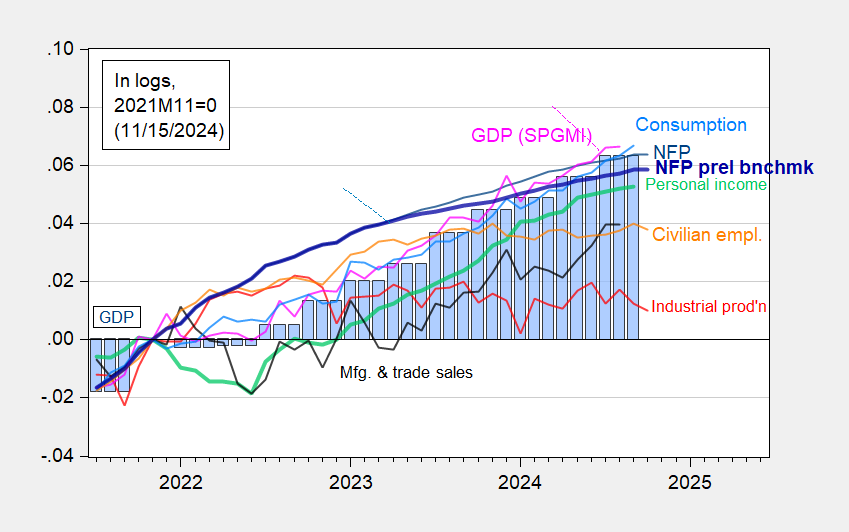
Industrial and manufacturing production down at consensus rate (-0.3% m/m for both). Core retail sales +0.1% vs. consensus +0.3% m/m. First up, series followed by the NBER’s Business Cycle Dating Committee (personal income and employment are key):
Figure 1: Nonfarm Payroll (NFP) employment from CES (blue), implied NFP from preliminary benchmark (bold blue), civilian employment (orange), industrial production (red), personal income excluding current transfers in Ch.2017$ (bold light green), manufacturing and trade sales in Ch.2017$ (black), consumption in Ch.2017$ (light blue), and monthly GDP in Ch.2017$ (pink), GDP (blue bars), all log normalized to 2021M11=0. Source: BLS via FRED, Federal Reserve, BEA 2024Q3 1st release, S&P Global Market Insights (nee Macroeconomic Advisers, IHS Markit) (11/1/2024 release), and author’s calculations.
I don’t include adjustment for weather related unemployed that can be ascribed to hurricanes; for this number in October, see Figure 1 in this post.
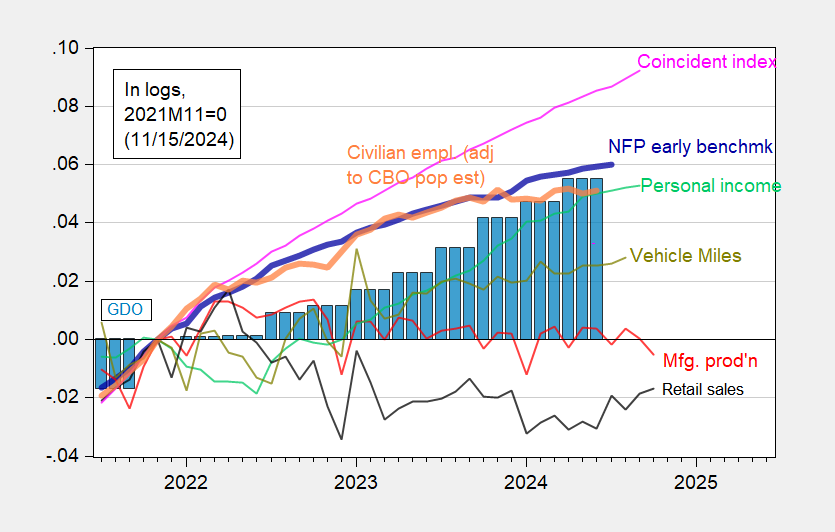
And here are some alternative indicators (on the same vertical scale for comparability):
Figure 2: Nonfarm Payroll early benchmark (NFP) (bold blue), civilian employment adjusted using CBO immigration estimates through mid-2024 (orange), manufacturing production (red), personal income excluding current transfers in Ch.2017$ (light green), retail sales in 1999M12$ (black), vehicle miles traveled (VMT) (chartreuse), and coincident index (pink), GDO (blue bars), all log normalized to 2021M11=0. Early benchmark is official NFP adjusted by ratio of early benchmark sum-of-states to CES sum of states. Source: Philadelphia Fed, Federal Reserve via FRED, BEA 2024Q2 third release/annual update, and author’s calculations.
Note that retail sales (deflated by chained CPI) has risen from 2024H1 lows.
Clearly, industrial production and manufacturing production are indicating a downturn. However, industrial production comprises only about 17% of value added, so it’s not as much an indicator of the broad economy as in the past.
Addendum:
See Jan Groen’s notes here on the implications of this week’s releases for the business cycle.
As of today, GDPNow for Q4 at 2.5%, NY Fed nowcast at 2.0, Goldman Sachs at 2.5%.


Off topic – what drives equity performance?:
“Origins of Stock Market Fluctuations”
https://www.nber.org/papers/w19818
The abstract:
“Three mutually uncorrelated economic disturbances that we measure empirically explain 85% of the quarterly variation in real stock market wealth since 1952. A model is employed to interpret these disturbances in terms of three latent primitive shocks. In the short run, shocks that affect the willingness to bear risk independently of macroeconomic fundamentals explain most of the variation in the market. In the long run, the market is profoundly affected by shocks that reallocate the rewards of a given level of production between workers and shareholders. Productivity shocks play a small role in historical stock market fluctuations at all horizons.”
So, perception of risk drives short-term stock performance. Changes in income shares drive longer-term stock performance. Productivity gains play only a small role in stock performance, short and long-term.
At least in this analysis, class warfare is the biggest driver of equity performance over the long haul. So far in this century, labor compensation has lagged far behind productivity gains:
https://fred.stlouisfed.org/graph/?g=1BdGT
Similarly, labor’s share of national income plummeted beginning around 2000:
https://fred.stlouisfed.org/series/LABSHPUSA156NRUG
Over the same period, the Shiller P/E has been above the historic average:
https://www.multpl.com/shiller-pe
Maybe P/E is the wrong way to look at this, but it sure is an interesting coincidence.
Anyhow, productivity gains, the vaunted “only free lunch” in economics, is clawed away from labor, but doesn’t do much for equity performance? That’s odd.
I won’t bother to connect these facts to election results. Y’all know the story.
OK, this is also off topic – (de-)dollarization and financial markets:
https://archive.ph/iumVz
China’s stimulus effort requires issuing lots of debt. Turns out, some of that debt will be dollar-denominated – $2 billion in 3s and 5s, so far. The cover was 20, which is to say $40 billion in bids. I don’t recall seeing a cover of 20 at a auction before, anywhere. With China’s stock of Treasuries, this issuance makes good sense. With downward pressure on the yuan from fiscal expansion and economic weakness, this also makes sense.
Not sure it reflects well on “de-dollarization”, though.
Thanks Macroduck for a most interesting off-topic comment. It does relate to Menzie Chinn’s post in that many active investors are wondering how an anticipated slowdown in the US economy might affect equity and bond markets.
Curious, did this paper or any derivative research ever get peer-reviewed published?
The perception of risk hypothesis does seem to explain a lot of stock market fluctuations and values currently observed. It seems odd that bond yields ramped up on a likely Trump win when overall the fiscal stance of both Harris and Trump candidates appeared to be so similar. Trump may be friendly to cryptocurrency but how his win boosts the intrinsic value of cryptocurrency escapes me.
Similarly, AI is enjoying a stock market rally but the opportunity to generate real economic rents appears largely absent.
Or, for an additional example, take the equity values of many oil and gas firms that generate significant cash flow, pay healthy dividends, have great balance sheets and yet trade at a fraction of the values observed in early part of the century and the late part of the last century. Global oil, similar to coal, keeps growing. ESG as an investment philosophy could explain that but to date the empirical evidence suggests that ESG as an investment strategy earns substandard returns. (ESG as a corporate doctrine is a completely different matter.)
The much vaunted transition is important for several reasons aside from anthropogenic climate disruption, yet junior metal explorers appear to have been starved of capital for many years now. Mind you that could reflect an understanding of the NIMBY issues holding up new mines and the environmental issues that have driven mining costs through the roof in recent decades.
As an investor, some days I wake up and feel like the more I know the less I understand.
For what it’s worth, Trump is officially below the 50% threshold for popular votes. Less than half of voters approved of Trump. Harris trails by less than 1.7% making it the closest election since 2000. And there are still some mailed votes to be counted in California, Oregon and Washington that are trending in the Harris direction.
So when you hear about the “overwhelming” victory and “mandate”, you can give it the same credence as Trump’s claim about his inaugural crowd size. He’s just lying.
Interesting. Have not seen latest counts in the media much. But as trump has found, control the narrative. He will continue to repeat that he won the popular vote in a landslide, and his porklings will believe and repeat that falsehood for the next 4 years.
this might be a record jump:
the Empire State Manufacturing Survey from the New York Fed, which covers all of New York state, a suburban NYC county in Connecticut, Puerto Rico and northern New Jersey, reported their headline general business conditions index rose from -11.9 in October to +31.2 in November, its highest reading in nearly three years, meaning that a significant majority of Second District manufacturers are now reporting improving conditions, after they had reported deteriorating business conditions last month..
so, my first thought was that’s just businesses celebrating Trump, but “The new orders index climbed thirty-eight points to 28.0, and the shipments index rose thirty-five points to 32.5, pointing to sharp increases in both orders and shipments.”
Oct industrial production was adversely impacted by the strike at Boeing, by Hurricane Milton and the lingering effects of Hurricane Helene…
also, fwiw, i get a 0.5% increase in real October PCE goods by adjusting retail sales with appropriate CPI indexes…that’s after real Sept PCE good is revised 0.2% higher, so that’ll provide a springboard for 4th quarter GDP
As to orders and shipments, I understand many firms with exposure to tariffs have boosted orders to deal with the risk of increased tariffs. If that’s a big part of the increase in the Empire orders and shipment indices, we should see three things – similar increases in other surveys, an increase in imports and a cooling in in all these things as warehouse space is filled up.
This would amount to moving activity forward, rather than an overall increase in activity. It would mean a drag on GDP from trade, with a corresponding lift to GDP from inventories, both to be reversed once warehouse capacity is used up. It is an additional cost of production even before tariffs are imposed.
In history this will be credited to the biden economy. If early 2025 sees a loss due to this action pulling forward, trump will be credited with a slumping economy.
Oh, and you’re close in suspecting this is the largest rise ever – it’s second largest rise since 2000 (the earliest FRED data). Only the Covid recession rebound is larger:
https://fred.stlouisfed.org/graph/?g=1Bnwy