It’s commonplace to correlate term spreads with future economic activity measured one way or thSo, while other. Recessions in the US do seem to be predictable on the basis of term spreads; but recessions are a binary variable insofar as the NBER, ECRI, and other institutions define it. What about growth as a continuous variable — be it growth of GDP or industrial production?
Chinn and Kucko (2015) noted that the predictive power of the 10yr-3mo spread for industrial production growth seemed to have decreased over time, with the slope coefficient statistically significant 1970-97, and not so 1998-2009. What about the more recent data? Using quarterly data 1967-2023Q3 (so for recession indicators up to 2024Q3) a Bai-Perron sequential break test indicates a break at 1984Q2, with the slope coefficient highly significant in the early period, and not so in the later.
What can we say about whether the slope coefficient has predictive power for some indicators and not others. Typically, at the monthly frequency, the proxy for growth has been industrial production since this has been the only long-span indicator available. Now, however, we have a variety of indicators, so we can now evaluate the predictive power of the spread (as well as other financial indicators) on monthly data.
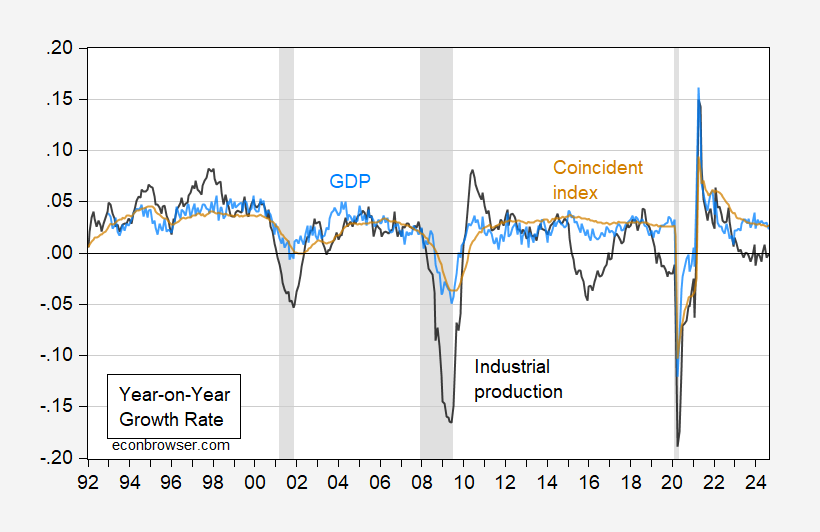
Here, I compare monthly GDP from S&P Global (formerly IHS-Markit, Macroeconomic Advisers) and the Philadelphia Fed’s coincident index against industrial production. The dependent variable is the year-on-year growth rate calculated using log-differences.
Figure 1: Year-on-Year growth rate of industrial production (black), of monthly GDP (sky blue), and coincident index (tan). NBER defined peak-to-trough recession dates shaded gray. Source: Federal Reserve and Philadelphia Fed via FRED, SPGMI (Nov 1 release), NBER, and author’s calculations.
Note that while all three measures are revised over time, the monthly GDP and coincident indexes are substantially and repeatedly revised (just like the quarterly official GDP series).
So industrial production growth deviates substantially on a y/y basis from GDP growth; and it does so even more when looking at m/m, as shown in Figure 2 (where I’ve truncated extreme movements in IP to be -6% m/m < growth < +6% m/m.
Figure 2: Scatterplot of m/m growth rate of monthly GDP against monthly industrial production, for range of -6% m/m < IP growth < +6% m/m (blue circles), nearest neighbor fit (red line).
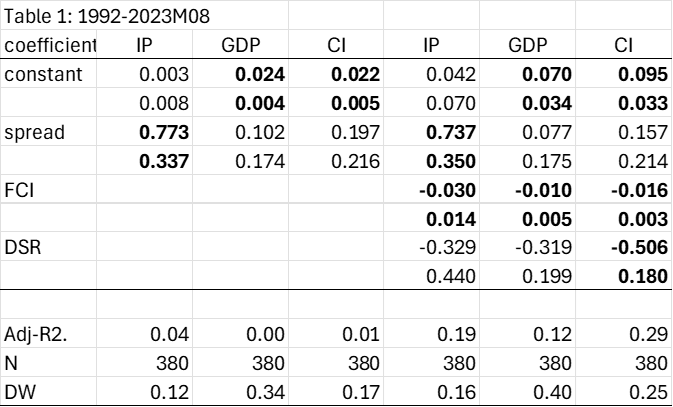
In Table 1 are the results for estimating the relationship over a common 1992-2023M08 sample (so the last observation on the dependent variable is the y/y growth rate in 2024M08). 1992 is the starting point as monthly GDP is not available earlier than that. The first three columns report simple bivariate regressions, while the next three augment the term spread with the Chicago Fed National Financial Conditions Index and the debt-service ratio (see Chinn and Ferrara (2024) for details of the latter, from the BIS).
Notes: Dependent variable is 12 month log difference of industrial production (IP), monthly GDP (GDP), or coincident index (CI). spread is the 10yr-3mo Treasury spread in bps, FCI is Chicago Fed National Financial Conditions Index, and DSR is the debt-service ratio for private nonfinancial sector, in decimal form. Bold face denotes statistical significance at 5% msl, using Newey-West robust standard errors. Source: author’s calculations.
The spread is a statistically significant determinant of the industrial production growth rate, but the proportion of variance explained is extremely low. Interestingly, this finding of a significant coefficient does not carry over to monthly GDP, or to the coincident index (which is a factor based on primarily labor market indicators).
If we augment the specification with FCI and DSR, these enter in significantly for IP growth. The FCI also enters in significantly for GDP growth and CI growth as well, with the difference being the spread is not statistically significant in either of those two cases. DSR is only significant for the Coincident Index.
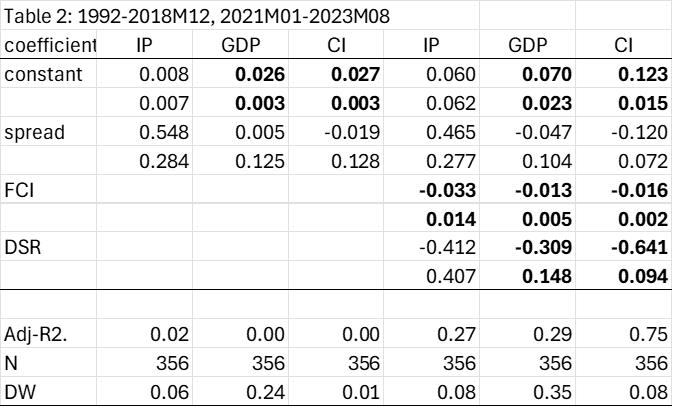
One might wonder if the results are being distorted by the inclusion of the pandemic period. In order to check this, I drop interest rate data from 2019M01-2020M12.
Notes: Dependent variable is 12 month log difference of industrial production (IP), monthly GDP (GDP), or coincident index (CI). spread is the 10yr-3mo Treasury spread in bps, FCI is Chicago Fed National Financial Conditions Index, and DSR is the debt-service ratio for private nonfinancial sector, in decimal form. Bold face denotes statistical significance at 5% msl, using Newey-West robust standard errors. Source: author’s calculations.
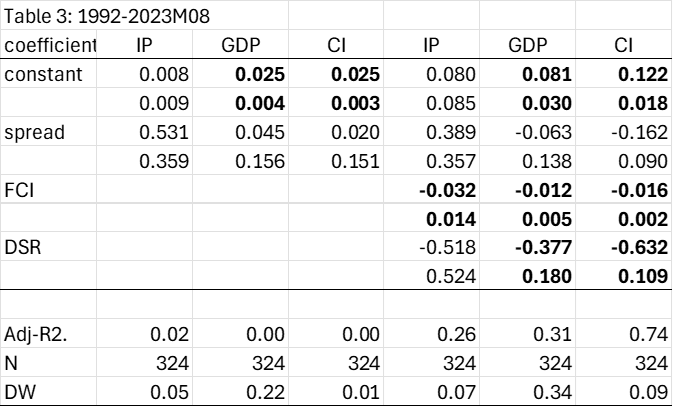
Now the spread does not enter in significantly in any specification (although it is significant at the 10% msl for the bivariate IP-spread regression). In fact, the importance of the spread seems to be an artefact of the pandemic period. For the sample predating the pandemic, one obtains the following estimates.
Notes: Dependent variable is 12 month log difference of industrial production (IP), monthly GDP (GDP), or coincident index (CI). spread is the 10yr-3mo Treasury spread in bps, FCI is Chicago Fed National Financial Conditions Index, and DSR is the debt-service ratio for private nonfinancial sector, in decimal form. Bold face denotes statistical significance at 5% msl, using Newey-West robust standard errors. Source: author’s calculations.
While it has been standard practice to take industrial production as a proxy for a broad aggregate, this is pretty much an expediency, rather than something economically motivated. Industrial production (mining, utilities and manufacturing) accounted for only 13% of GDP in 2023. So if one wants to investigate the implications of financial indicators for aggregate economic activity, it makes more sense to focus upon GDP.
The conclusion is that the term spread does predict IP growth, but doesn’t predict overall economic activity, over the last thirty years. Interestingly, in line the findings in Ahmed and Chinn (2024), the foreign term spread does predict GDP.


“…a Bai-Perron sequential break test indicates a break at 1984Q2, with the slope coefficient highly significant in the early period, and not so in the later.”
This looks nearly coincident with the beginning of “the Great Moderation”. Prior to 1983, deep inversions were more common than in more recent years. Since the Great Moderation, the only 10-year/three-month inversion greater than 100 basis points began in 2023.