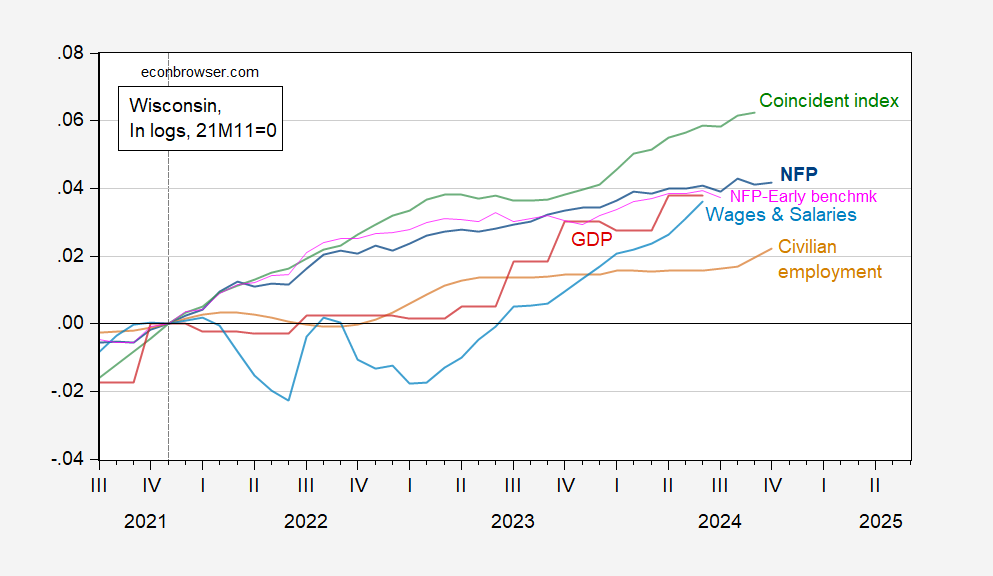
NFP and private NFP up (although below recent peaks), while civilian employment rises.
Figure 1: Wisconsin Nonfarm Payroll Employment (dark blue), Philadelphia Fed early benchmark for NFP (pink), Civilian Employment (tan), real wages and salaries, deflated by national chained CPI (light blue), GDP (red), coincident index (green), all in logs 2021M11=0. Source: BLS, DWD, BEA, Philadelphia Fed, and author’s calculations.
Since the civilian employment series is based on a much smaller sample (at the state level), it is best to rely on the establishment series. Here NFP are trending sideways relative to mid-2024 levels.
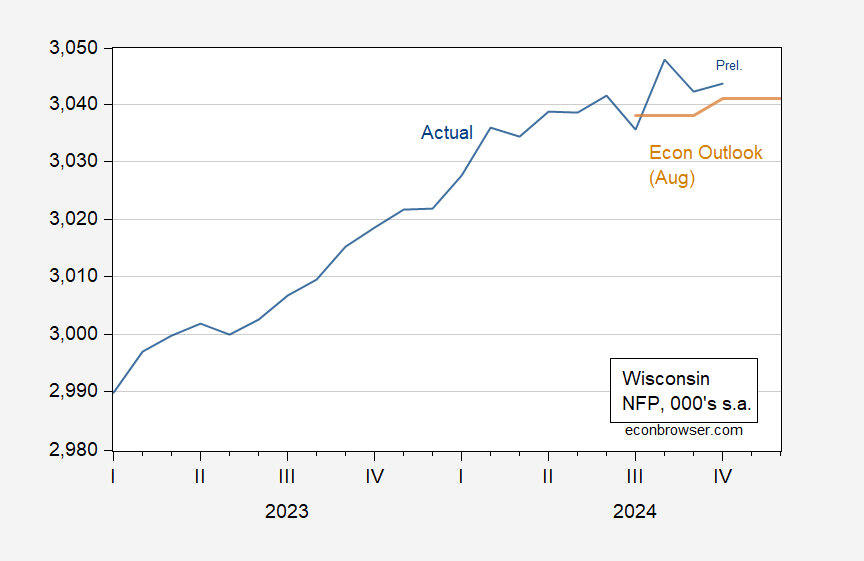
Here’s how nonfarm payroll employment compares to the August Dept of Revenue forecast:
Figure 2: Wisconsin nonfarm payroll employment (blue), and Wisconsin DoR Economic Outlook forecast of August (tan), both in 000’s, s.a. Source: BLS, DWD, DoR.


Off topic – Businesses preparing for tariff increases:
https://www.axios.com/2024/11/12/trump-tariffs-china-mexico-supply-chain
This report is entirely anecdotal – we get no idea of the magnitude of adjustment already underway of planned. That’s not a criticism – it couldn’t be otherwise at this early date.
One thing that pops out for me is tariff arbitrage. This report suggests moving production from China, which face the greatest threatened tariff increase, to countries threatened with lesser increases. Not much talk of bringing production home.
The point is made that shifting sourcing away from China (Mexico?) means shifting from where capacity already exists to countries which do not currently have the capacity to replace Chinese supply. First come, first served? Top bid wins? Either way, there is limited capacity to source outside of China (Mexico).
This is not the only press report to observe that this threatened round of tariff increases comes when consumers are more price-sensitive than last time. It may be that profit margins and overall levels of demand are squeezed more this time than last time, if Trump carries out his threatened tariff increases.
This report confirms that some businesses are front-running tariff increases by stocking up on imports now. That’s a current cost, occurring in a high-interest-rate environment. Tough on margins in the near term.
it will be hard for business to arbitrage tariffs. why? because i do not believe trump will unilaterally apply tariffs in the way he campaigned. he will apply tariffs individually to each nation, and each industry. then he will “negotiate” the deals, and claim credit for each tariff that does or does not happen. there will be little logic to the operation, other than it must be transactional in trump’s favor. the only consistent policy will be the trump “me first” policy. no national policy will be uniformly implemented.
That’s kinda what he did last time – exceptions left and right, all on a whim. But it’s a big world, and China’s a big part if global manufacturing. So unless Trump hits China and nobody else, there’s probably going to be a tariff/no tariff choice for some importers, but a need to go tariff shopping for others.
The problem you identify is a central problem with Trump’s “I make all the decisions” way of governing. Huge uncertainty. Highly arbitrary. Unprincipled. Unfair.
for trump, it is not a policy. it is a transaction. he wants to “win” each transaction, irregardless of the big picture. the world could simply keep him occupied with a million different tariff deals over the four years, and he would probably forget about everything else. Europe should engage him in tariff negotiations when they need him to forget about Ukraine issues for a while. distraction politics.