Industrial and manufacturing production (+0.9% m/m vs. +0.3% consensus; +0.6% m/m vs. +0.2% consensus), retail sales (control) surprise on the upside. First, indicators followed by the NBER BCDC:
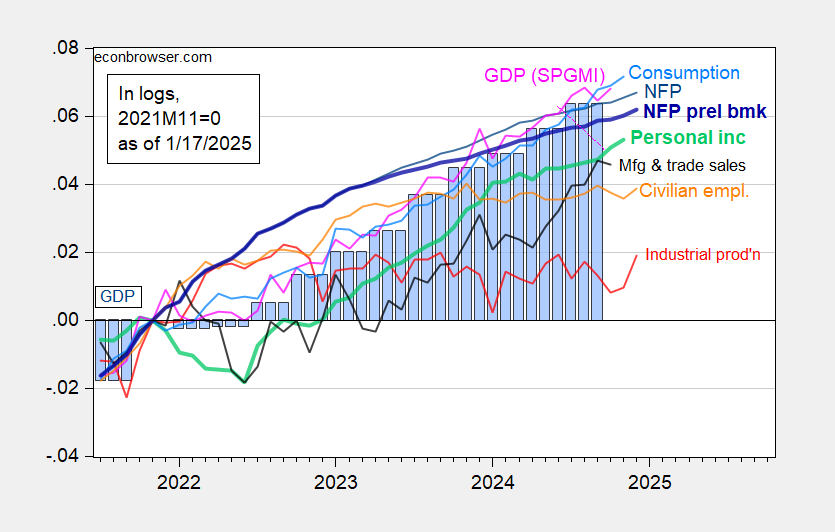
Figure 1: Nonfarm Payroll (NFP) employment from CES (blue), implied NFP from preliminary benchmark (bold blue), civilian employment (orange), industrial production (red), personal income excluding current transfers in Ch.2017$ (bold light green), manufacturing and trade sales in Ch.2017$ (black), consumption in Ch.2017$ (light blue), and monthly GDP in Ch.2017$ (pink), GDP (blue bars), all log normalized to 2021M11=0. Source: BLS via FRED, Federal Reserve, BEA 2024Q3 3rd release, S&P Global Market Insights (nee Macroeconomic Advisers, IHS Markit) (12/2/2024 release), and author’s calculations.
Second, alternative indicators, which paint a similar story of continued growth, with adjusted for CBO estimated immigration employment higher. On the other side, vehicle miles traveled was down in October and November.
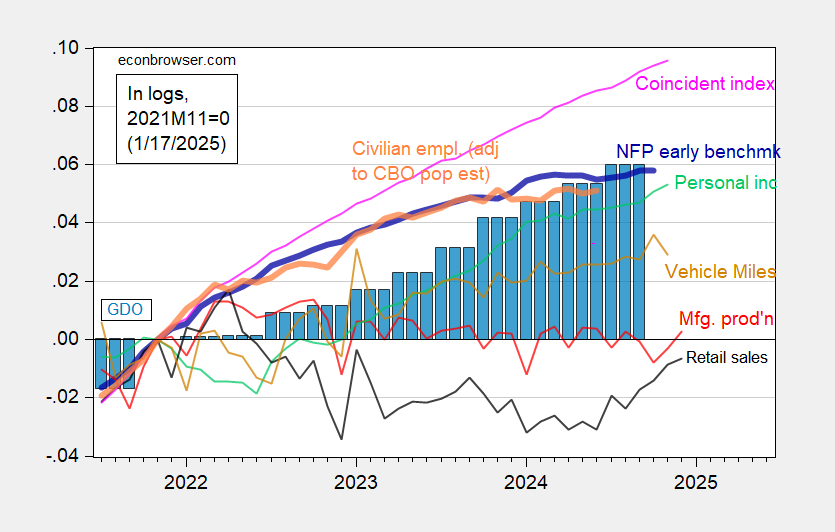
Figure 2: Implied nonfarm Payroll early benchmark (NFP) (bold blue), civilian employment adjusted using CBO immigration estimates (orange), manufacturing production (red), personal income excluding current transfers in Ch.2017$ (bold green), manufacturing and trade sales in Ch.2017$ (black), consumption in Ch.2017$ (light blue), and monthly GDP in Ch.2017$ (pink), GDO (blue bars), all log normalized to 2021M11=0. Source: Philadelphia Fed [1], Philadelphia Fed [2], Federal Reserve via FRED, BEA 2024Q3 third release, , and author’s calculations.
Using data from 2021M04 to 2024M12, assuming I am doing the analysis correctly, it looks like using a trend model of log values of FRED series, INDPRO, there is a breakpoint unit root as of 2022M02, with the new trend starting 2022M03. FRED series INDPRO was at 102.7 as of 2020M03 and has been edging lower with a zigzag pattern. Although the December 2024 reading is 103.2, the trend model shows decreasing values for INDPRO. The trend forecast from the model forecasts 102.6 for January 2025. It will be interesting to see if the INDPRO index will zigzag down in January 2025. For the new trend to be gain some additional support, the January INDPRO forecast shows a decline of 0.6% to continue the zigzag pattern.
Have you considered doing the same analysis using manufacturing production rather than industrial production? Industrial production includes utilities and mining. For that reason, weather is always a tricky factor in the short term for industrial production. U.S. uility output is also not tradable outside North America, so industrial production mixes tradables with non-tradables (less-tradables?). Teasing those apart might tell you a good bit.
MD,
Thanks for the response and suggestion.
I will give it a try to see what results.
Results for IPMAN look similar to INDPRO
The break point is 2022M05 for IPMAN vs. 2022M02 for INDPRO
IPMAN
Using data from 2021M04 to 2024M12, it looks like using a trend model of log values of FRED series, IPMAN, there is a breakpoint unit root as of 2022M05, with the new trend starting 2022M06. FRED series IPMAN was at 100.4 as of 2022M06 and has been edging lower with a zigzag pattern. The December 2024 reading is 99.9. The trend model shows decreasing values for IPMAN. The trend forecast from the model forecasts 99.3 for January 2025. Similar to INDPRO, it will be interesting to see if the IPMAN index will zigzag down in January 2025. As with INDPRO, for the new trend to be gain some additional support, the January IPMAN forecast shows a decline of 0.6% to continue the zigzag pattern.
I notice I cited an INDPRO index value of 102.7, which should be for 2022M03, not 2020M03. The 102.7 value occurs at the beginning of the new trend date, which 2022M03
We will see.
Thanks. Interesting stuff. Any persistent divergence is worth picking up on.