GDPNow at -1.5% q/q AR. But final sales to domestic purchasers little changed.
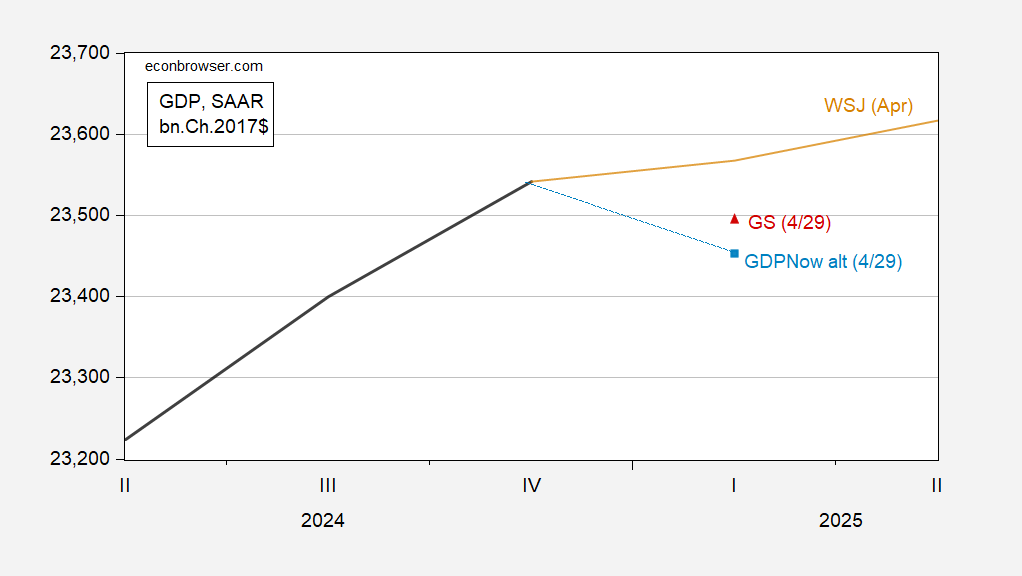
Figure 1: GDPNow of 4/29 (blue square), Goldman Sachs tracking of 4/29 (red triangle), Wall Street Journal mean survey (tan line). Source: BEA, Atlanta Fed, Goldman Sachs and author’s calculations.
With one day left to Q1 release, GDPNow should be pretty close to advance, given historical records. GDP is nowcasted to be growing below the lowest (20% trimmed) April WSJ forecast (Carlton Strong/JPMorgan), and only above 4 out of 62 forecasts.
Note that final domestic purchasers (cited by Jason Furman as “core GDP”) is still nowcasted to rise, little changed from the April 24th post.
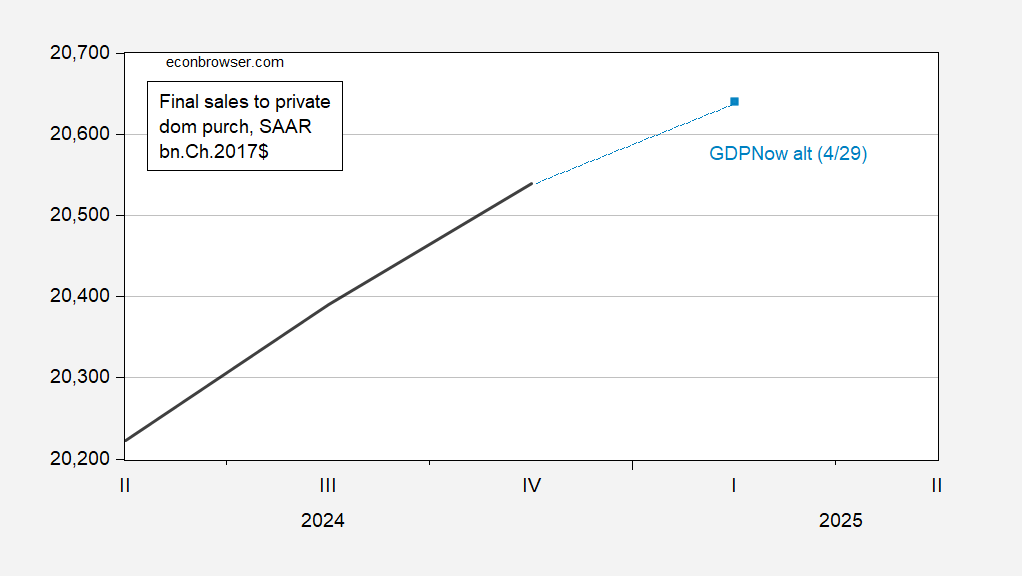
Figure 2: Final sales to private domestic purchasers (black), and GDPNow of 4/19 (light blue square). Source: BEA, Atlanta Fed and author’s calculations.
Since this series is plotted on a log scale, final sales to private domestic purchasers is only decelerating from 2.9% q/q AR to 2% q/q AR (log changes).
With respect to economic sentiment, the Conference Board’s Consumer Confidence Index collapsed to below consensus (86.0 vs. consensus 87.7).
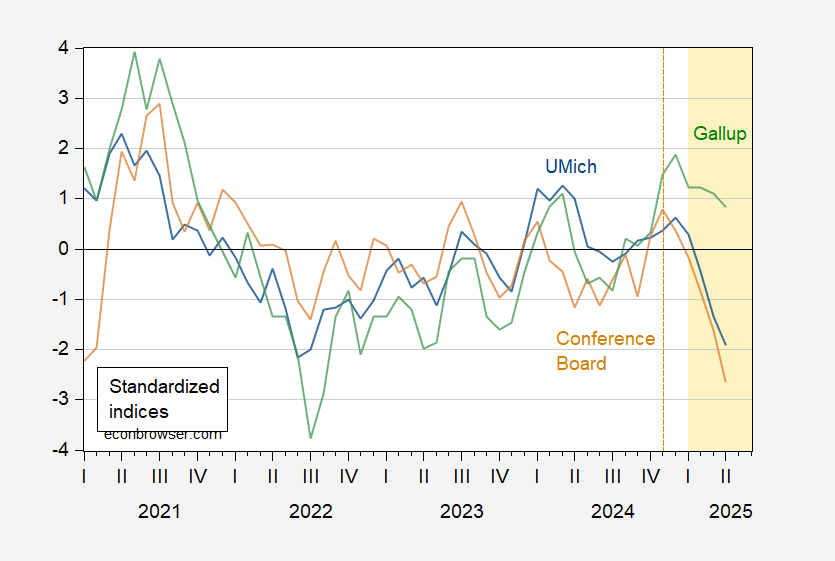
Figure 3: U.Michigan Economic Sentiment (blue), Conference Board Confidence Index (brown), Gallup Confidence (green), all demeaned and divided by standard deviation 2021M01-2025m02. Source: UMichigan, Gallup, Conference Board, and author’s calculations.
The confidence index was driven by the rapid descent in the expectations component:
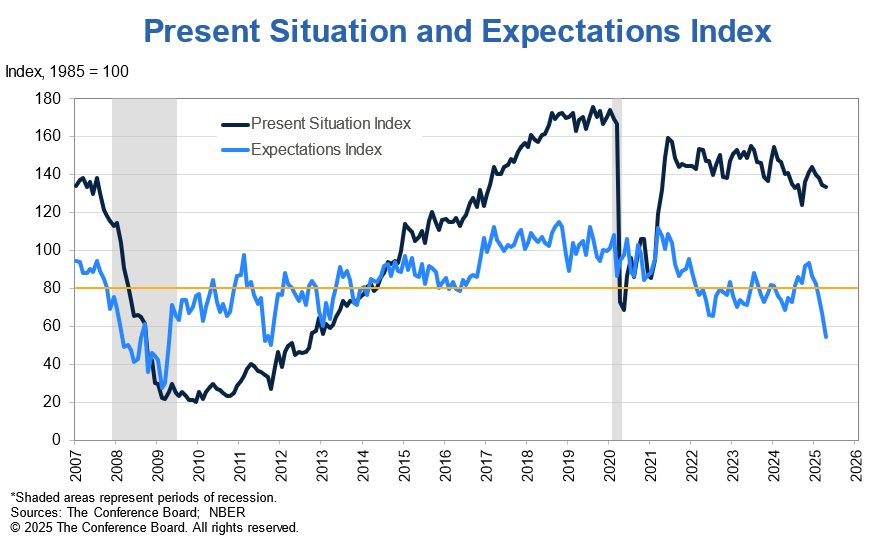
Hence, despite continued strength in final sales in Q1 (remember we’re already halfway through Q2), the outlook appears dim.
This is fake data. everybody knows prices are falling and the US economy is in a boom.
Hey I do have some shares in the harbour bridge to sell!
Redbook has sales pretty steady mid-way through April:
https://tradingeconomics.com/united-states/redbook-index
Carfax reports strong used vehicle sales and prices in April, citing tariffs as the reason for outsized gains:
https://www.carfax.com/used-car-index
New car sales were strong in March, also a reflection of expectations of shortages due to tariffs.
Some thrift stores report improved sales, probably a reaction to price concerns rather that reduced supply – so far:
https://www.yahoo.com/news/thrift-second-hand-clothing-stores-222637261.html
UPS just announced another 20,000 job cuts, apparently in response to Amazon pricing rather than tariffs:
https://www.wsbtv.com/news/trending/ups-cut-20000-jobs/NTMEAV5KMJAZZMLDG25VJDOSPY/
Not sure whether that has macro implications.
So GDP fell in Q1 in spite of documented front running of tariffs. No wonder Trump is desperately trying to bail out of his tariffs on China.
I am not sure Xi will let him do that. After all Xi has to let the Chinese people suffer through a restructuring of the economy – and Trumps trade attacks are the perfect way to shift blame away from himself.
Real GDP fell 0.3% (SAAR) in Q1. Real final sales to domestic private purchases rose 2.3% (SAAR).PCE up 1.8%. PCE dedlator 3.6%, core 3.5%.
So ahead of the main hit from tariffs, inflation was a problem, but underlying growth was not.
Job growth, on the ither hand, looked peaked. ADP reported just 62,000 new private sector jobs in April – less than half the 144,000 pace in March, and we know from yesterday’s JOLTS data (if there was any doubt) that federal job cuts were already hitting in March.
Seevices added just 34,000 jobs, in keeping with New Deal democrat’s observation that recent service surveys show weakness. Good producing jobs, on the other hand, trotted along nicely at 26,000, mostly but not all in construction.
By the way, it looks like vehicle sales added about 0.3% to real GDP (SAAR) in Q1:
https://fred.stlouisfed.org/graph/?g=1IEeX
That helps explain the strength of personal consumption in the quarter, and may represent front-running of tariffs.
I must say, very surprised by the silence from the trump cheerleaders like bruce hall and rick stryker. have they been banned like the trolls corev and peak trader? or simply hiding under a rock while their man trump decimates the us economy?