GDPNow at essentially zero growth. Industrial production, retail sales (control) surprise downside.
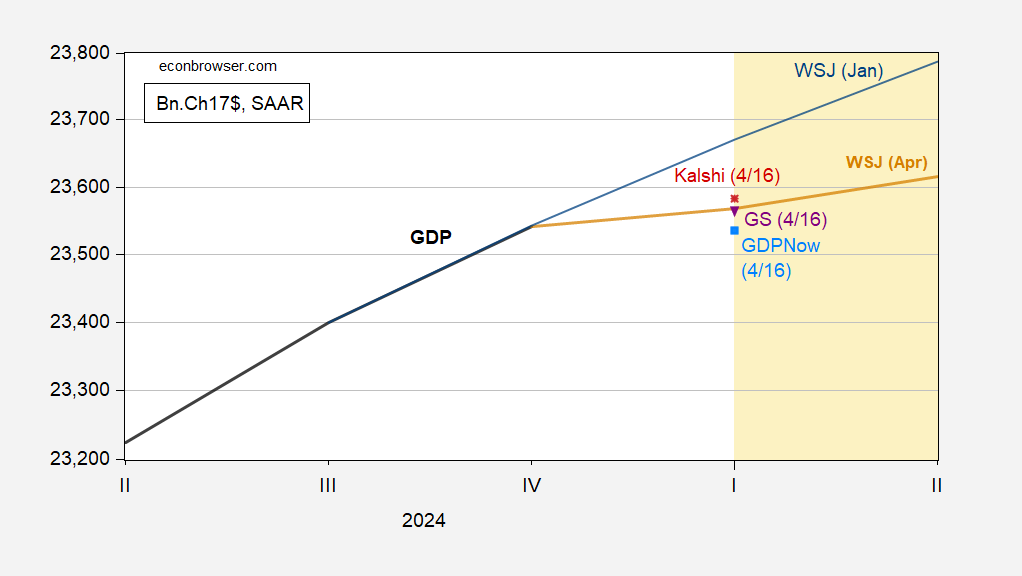
Figure 1: GDP (bold black), WSJ January survey mean (blue), WSJ April survey mean (tan), GDPNow of 4/16 (sky blue square), Goldman Sachs tracking forecast of 4/16 (inverted purple triangle), Kalshi forecast of 4/16 (red *), all in billions Ch.2017$ SAAR. Source: BEA 2024Q4 3rd release, WSJ survey.
That being said, net exports are providing an outsized negative contribution in an accounting sense to Q1 GDP (-2.86 ppts q/q AR).
Business cycle indicators augmented today with industrial production indicate a slowdown, but we don’t yet have the critical consumption and personal income numbers for March.
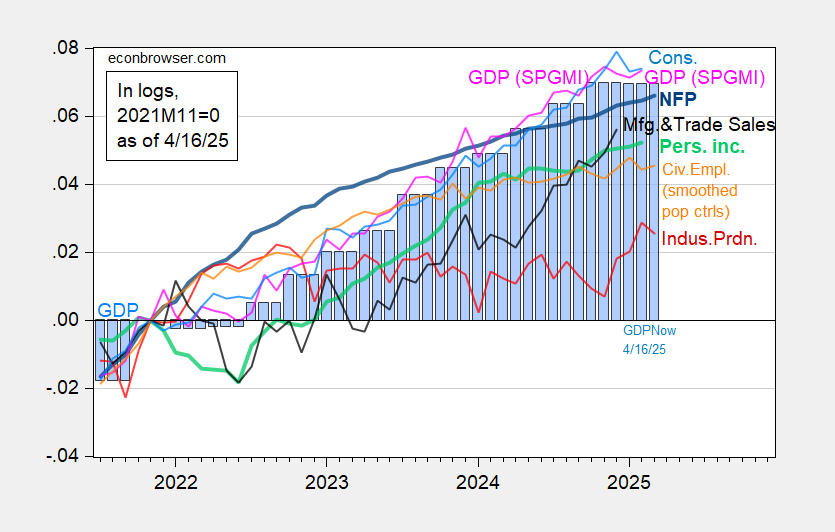
Figure 2: Nonfarm Payroll incl benchmark revision employment from CES (bold blue), civilian employment using smoothed population controls, spliced to official (orange), industrial production (red), personal income excluding current transfers in Ch.2017$ (bold light green), manufacturing and trade sales in Ch.2017$ (black), consumption in Ch.2017$ (light blue), and monthly GDP in Ch.2017$ (pink), GDP (blue bars), all log normalized to 2021M11=0. Source: BLS via FRED, Federal Reserve, BEA 2024Q4 3rd release, S&P Global Market Insights (nee Macroeconomic Advisers, IHS Markit) (4/1/2025 release), and author’s calculations.
Here’s a picture of real retail sales ex-food sales, and ex-motor vehicles.
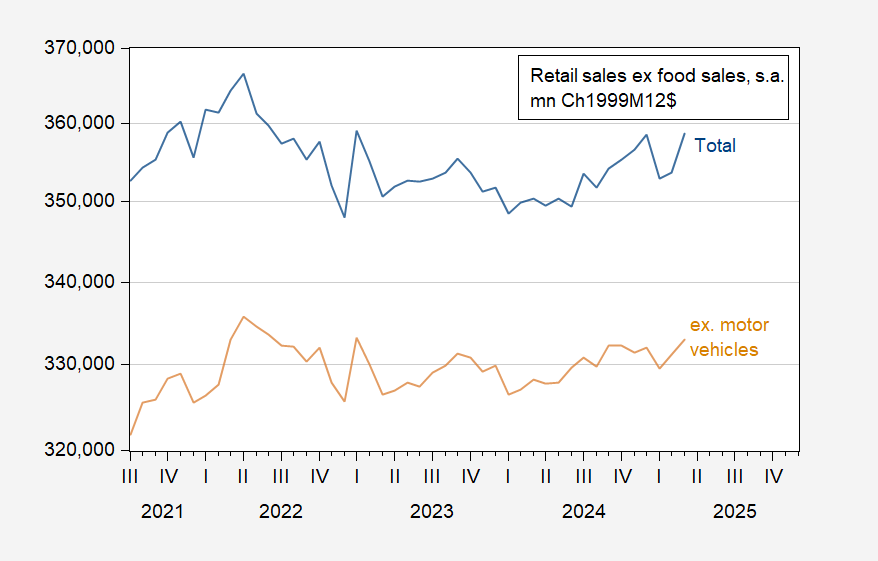
Figure 3: Total retail sales ex-food sales (blue), Retail sales ex-food sales and ex-motor vehicles (tan), mn.Ch.1999M12$, s.a. Source: BEA, BLS via FRED, and author’s calculations.
By my accounting, nominal motor vehicle sales increased 13% m/m (not annualized), while non motor vehicle sales rose 0.5%, In other words, there’s a lot of tariff jumping aimed at avoiding higher car prices.
The big oddity so far in Q1 consumption data is the drop in services:
https://fred.stlouisfed.org/graph/?g=1IcIX
If services come back strongly, in March or in revisions to prior months, that would change ge the complexion of Q1 economic performance.
Service consumption amounts to roughly 45% of GDP, vs roughly 24% for goods. Services consumption packs a punch.
For anyone interested, here’s a really good piece on game theory as applied to international trade:
https://medium.com/@laurelweber/what-game-theory-can-tell-us-about-tariffs-e7c0c70a897d
The author, who goes by Laurel W, acknowledges that the payoff matrix is critically important, and generously suggests economists might do a better job specifying the matrix than she has. Beg to differ. The payoff matrix is exactly what has everyone buffaloed. The felon-in-chief has not made his payoff preferences obvious.
If sucking up in public is what he requires, then the matrix (matricies) will include the humiliation tolerances of other national leaders. Anybody have a metric for that? Laurel’s estimates of economic performance clearly belong in each matrix, alongside the suck-up/humiliation factor. The felon has made obvious that he values U.S. economic welfare less than most folks had anticipated, much less than other parties value their country’s welfare, but we have no clue how to balance the felon’s vanity against economic welfare in the payoff matrix.
Anyhow, real Laurel W’s article. Odds are, you’ll learn something, no matter how much you know. She’s going on my list.
Today’s 2.2% drop in the S&P was accompanied by a modest drop in interest rates – Gott sie Dank – but the dollar (DXY) lost another 1%. So the unwinding of basis trades is apparently no longer the main feature of Treasury trade, but the defection from dollar assets continues.
Here’s a picture of the daily % change in the dollar index:
https://fred.stlouisfed.org/graph/?g=1Id5c
As you can see, changes of 1% are not common, but have happened with increased regularity this year.
There’s a lot of business and households decisions that are not showing up in the numbers yet, including layoffs, production, and inventory decisions.
Always expect a lag in data.
except for the pop in car sales, there’s no sign of where those back to back months of record imports went yet; as i’ve posted here before, Exhibit 10 in the February trade report indicates they grew at a 89.59% rate in 2017$, with the potential to subtract about 9.65 percentage points from 1st quarter GDP….that should be offset by a jump in inventories (or PCE) but as of yesterday’s report, real inventories, adjusted with appropriate PPI indices, appear to be negative…
Yeah, I think you are onto something. Big revisions are brewing, maybe. We can speculate as to what will be revised – I’d guess customs data are pretty solid. The underlying problem is that big swings in activity screw with samples, and we have had big swings.
since trump came into office, inflation has driven up the daily cost of living. he has also driven up the rates on mortgages. he promised to lower both on day one during his campaign. was he lying, or is he failing? bruce hall and rick stryker, I notice neither of you are out defending the felon in chief much these days? you must be disappointed in his actions as well.