A reader asks me about my 2025H1 recession call. I don’t have one, but here’s the latest depiction of indicators followed by the NBER Business Cycle Dating Committee, as well as alternatives. Only consumption and vehicle miles traveled (and heavy truck sales) seem indicative of recession (maybe GDP using GDPNow).
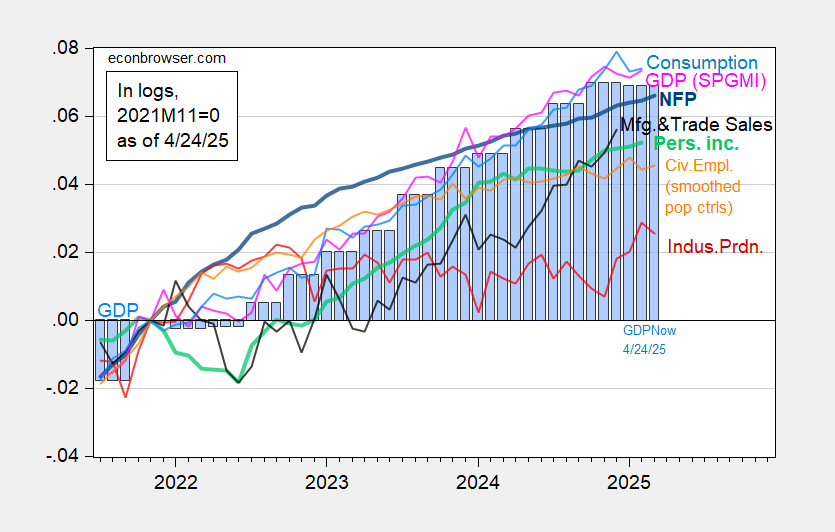
Figure 1: Nonfarm Payroll incl benchmark revision employment from CES (bold blue), implied NFP from preliminary benchmark through December (thin blue), civilian employment as reported (orange), industrial production (red), personal income excluding current transfers in Ch.2017$ (bold light green), manufacturing and trade sales in Ch.2017$ (black), consumption in Ch.2017$ (light blue), and monthly GDP in Ch.2017$ (pink), GDP (blue bars), all log normalized to 2021M11=0. 2025Q1 GDP is GDPNow as of 424/2025. Source: BLS via FRED, Federal Reserve, BEA 2024Q4 3rd release, S&P Global Market Insights (nee Macroeconomic Advisers, IHS Markit) (4/1/2025 release), and author’s calculations.
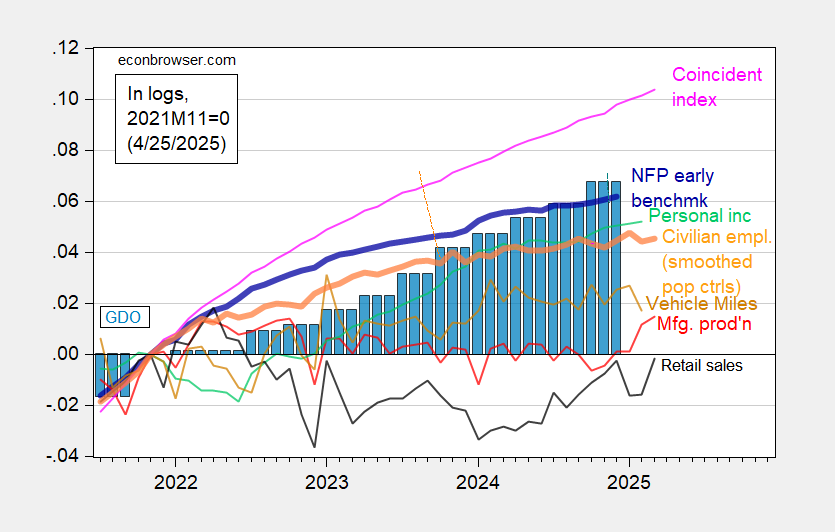
Figure 2: Implied Nonfarm Payroll early benchmark (NFP) (bold blue), civilian employment adjusted smoothed population controls (bold orange), manufacturing production (red), personal income excluding current transfers in Ch.2017$ (bold green), real retail sales (black), vehicle miles traveled (tan), and coincident index in Ch.2017$ (pink), GDO (blue bars), all log normalized to 2021M11=0. Source: Philadelphia Fed [1], Philadelphia Fed [2], Federal Reserve via FRED, BEA 2024Q4 3rd release, and author’s calculations.
One interesting indicator of how uncertainty has paralyzed investment is this picture of heavy truck sales:
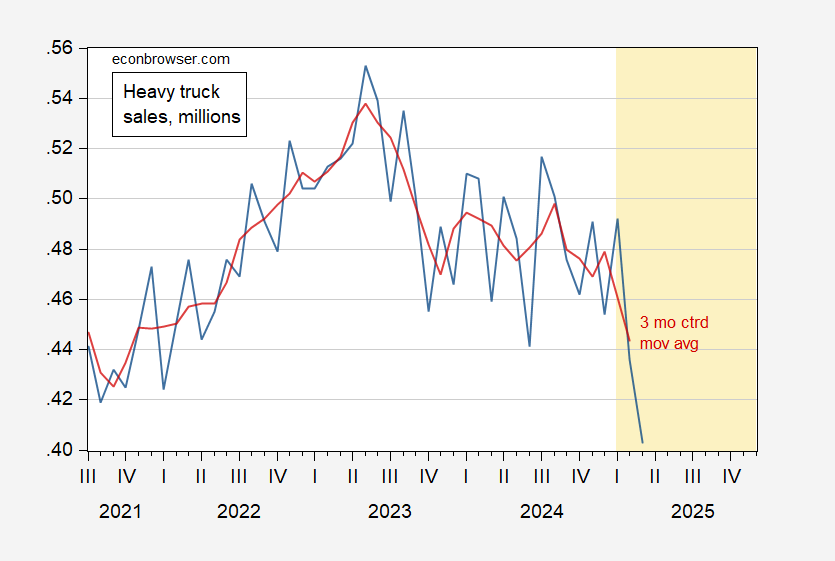
Figure 3: Heavy truck sales, millions of units s.a. (blue), 3 month centered moving average (red). Source: BEA via FRED, and author’s calculations.
When I first saw this title, my guess was that it would relate to probit models based on the yield curve. In that regard I had a brief exchange with Prof. Chinn early this year about those probit models. My question was, at what point would such forecasts be false? If I recall correctly, the forecasting period was 12 months +/-6 months.
So today I went back to check when the probit models forecast recession following the pandemic. As far as I could find, the earliest such note was in June 2023:
https://econbrowser.com/archives/2023/06/recession-probabilities-based-on-multiple-financial-measures
although several of the models (WSJ if I recall correctly) forecast recession as early as late 2022.
While I don’t know the exact inputs into the probit models, I thought I would take a K.I.S.S. look. (Also, please note importantly: I am not criticizing any work done by Prof. Chinn; I just wanted to satisfy my own curiosity).
The 10 year minus 2 year Treasury spread first inverted in July 2022. The 10 year minus 3 month followed suit in October 2022, and the 10 year minus Fed Funds spread in November. The 10 year minus 2 year spread un-inverted in September 2024 and has remained un-inverted ever since. The other two spreads un-inverted in December, and have oscillated back and forth into reversion and out of it since.
For purposes of this comment, let’s assume the economy was not in recession in Q1 of this year. Let’s further assume that the forecasts from yield curve inversions are recession starting in 12 months, +/-6 months.
In that case, all forecasts based on the yield curve inversions up to and including September 2023 were false. The jury is still out on forecasts thereafter.
Perhaps more importantly right now, if the economy tips into recession based on the chaotic trade policies of the new Administration in Washington, I would consider that a superseding cause, much like Covid lockdowns in March and April 2020. Which would mean we can never know if the probit models based on the yield curve were accurate or not.