Up for all three, although production essentially flat since February, and real retail sales down since March. Indicators followed by the NBER’s BCDC in Figure 1:
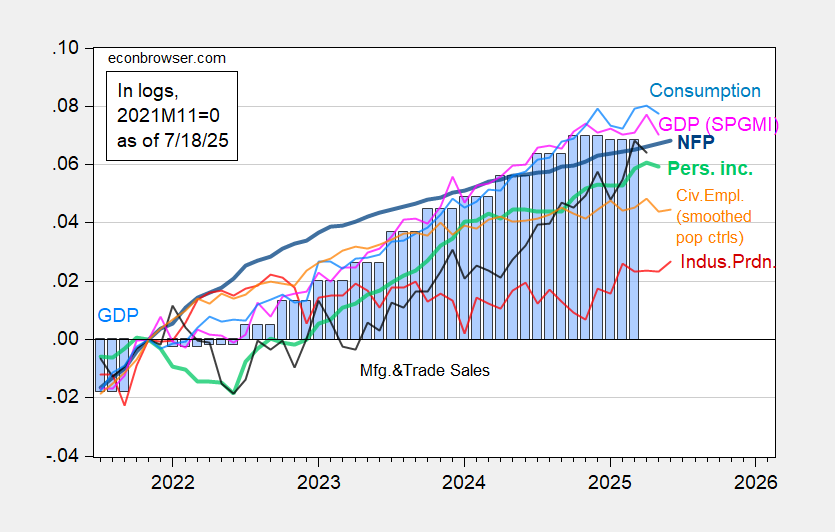
Figure 1: Nonfarm Payroll incl benchmark revision employment from CES (bold blue), civilian employment using smoothed population controls (orange), industrial production (red), personal income excluding current transfers in Ch.2017$ (bold light green), manufacturing and trade sales in Ch.2017$ (black), consumption in Ch.2017$ (light blue), and monthly GDP in Ch.2017$ (pink), GDP (blue bars), all log normalized to 2021M11=0. 2025Q1 GDP is third release. Source: BLS via FRED, Federal Reserve, BEA, S&P Global Market Insights (nee Macroeconomic Advisers, IHS Markit) (7/2/2025 release), and author’s calculations.
Alternative business cycle indicators:
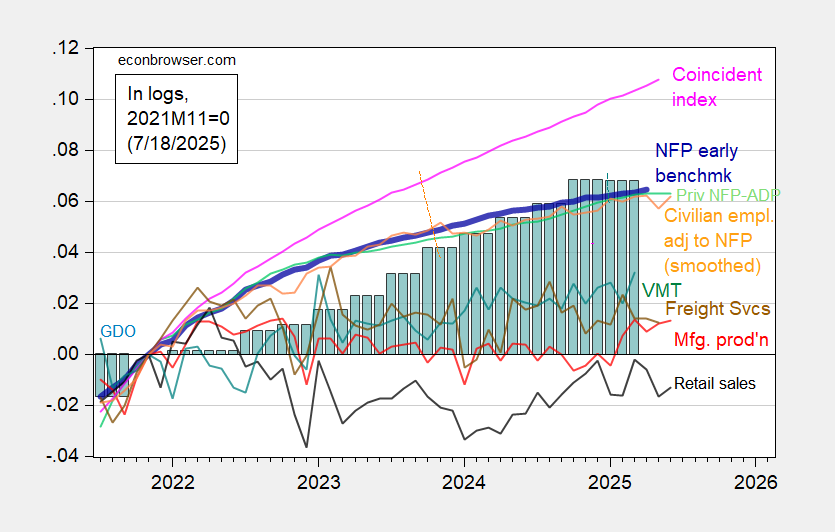
Figure 2: Preliminary Nonfarm Payroll early benchmark (NFP) (bold blue), civilian employment adjusted to NFP concept, with smoothed population controls (orange), manufacturing production (red), real retail sales (black), and coincident index in Ch.2017$ (pink), GDO (blue bars), all log normalized to 2021M11=0. Source: Philadelphia Fed [1], Philadelphia Fed [2], Federal Reserve via FRED, BEA 2025Q1 third release, and author’s calculations.
AI datacenter spending is masking a slowdown in other areas. It is now, in my view, in bubble territory. That is, the speculative spending is exceeding the eventual cost benefits. AI may replace some current revenue sources.. but to be profitable it must significantly add to them. In other words, the profits must come from businesses and people increasing their spending, not from substitution.