Torsten Slok provides this illuminating picture of discretionary spending (y/y), by category.
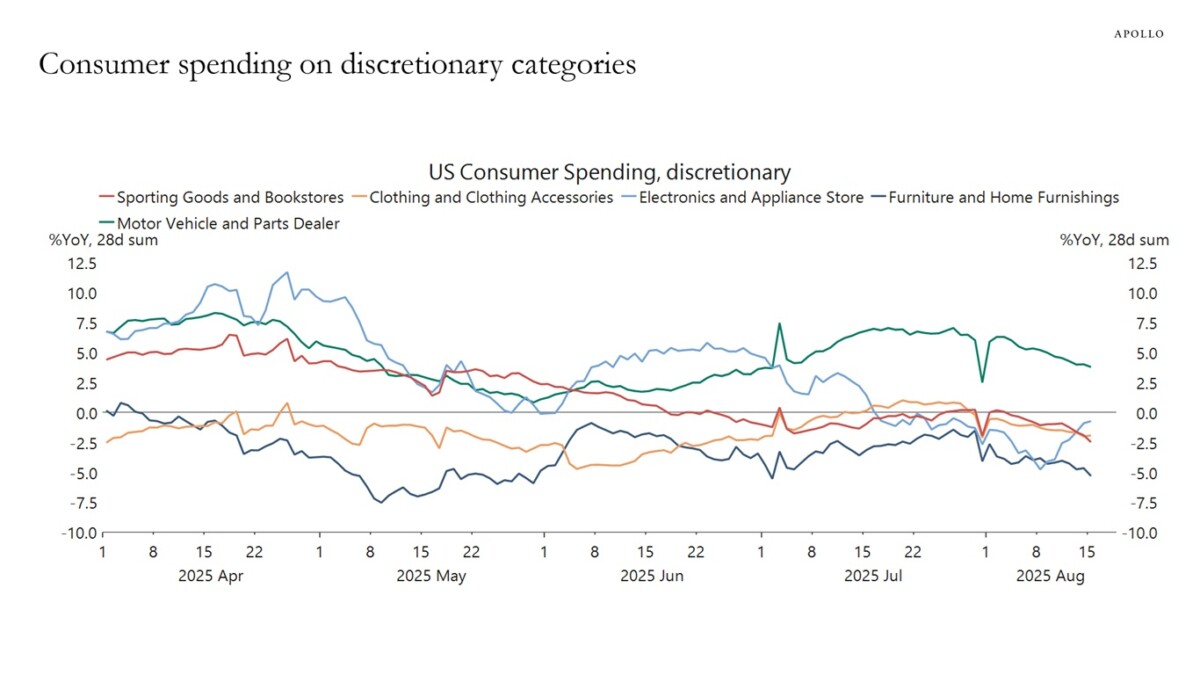
A year ago, I wrote about how the lack of clearly slowing discretionary spending failed to signal a slowdown. And indeed no recession followed. What would really be helpful now is the corresponding picture from Andreolli et al. (2024), updated.
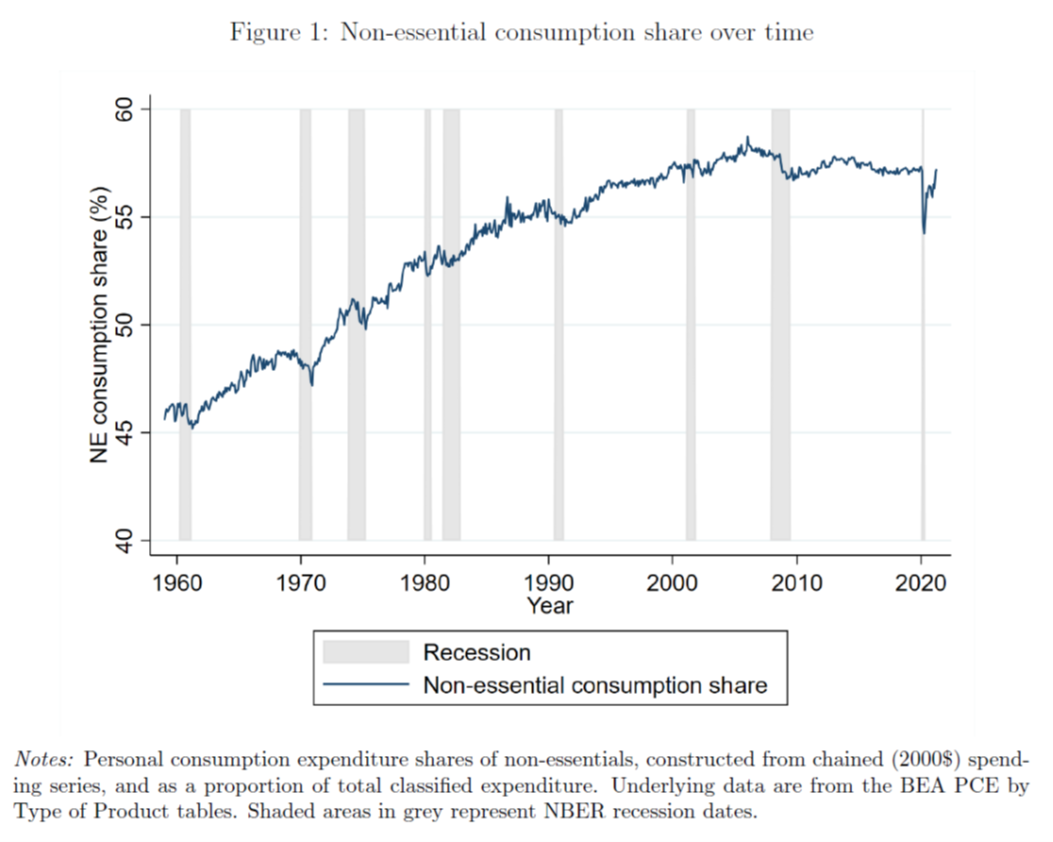
Source: Andreolli et al (2024).
The second figure, from Andreolli et al., suggests a change in behavior after the Great Recession. After decades of non-essentials making up a larger share of spending, that share flattened out after the crash.
What happened? Did spending shift away from Andreolli’s definition, or has the steady improvement in household income relative to essentials stopped?
Or mayb it’s a response to wealth. First step in my WAG, it looks like it has something to do with the savings rate:
https://fred.stlouisfed.org/series/PSAVERT
The decades-long slide in the personal savings rate accompanied the increasing share of non-essentials in household consumption. A massive decline in household wealth in the housing crash seems like a good reason to limit non-essential spending.
There was another big drop in wealth during the Fed’s latest tightening, mostly concentrated in financial assets rather than real ones. However, supply interruptions obviously made a mess of the non-essentials series during and after the Covid recession, so I’m not sure how much we can gleen from the behavior of the non-essentials series in the supply-squeeze period.
Oddly, demand for non-essentials doesn’t seem very responsive to the real median wage in the latter years of the pre-Covid expansion; the median real wage shot up while the non-essentials share held steady:
https://fred.stlouisfed.org/series/MEHOINUSA672N#
Anyhow, seems complicated to me. The observation by Andreolli et al. that distribution of jobs and income influence demand for non-essentials might make things less complicated, but I haven’t thought through how.