Based on residential investment construction July release (starts 1.428 mn > 1.29 mn Bbg consensus; permits 1.354mn < 1.39mn Bbg consensus):
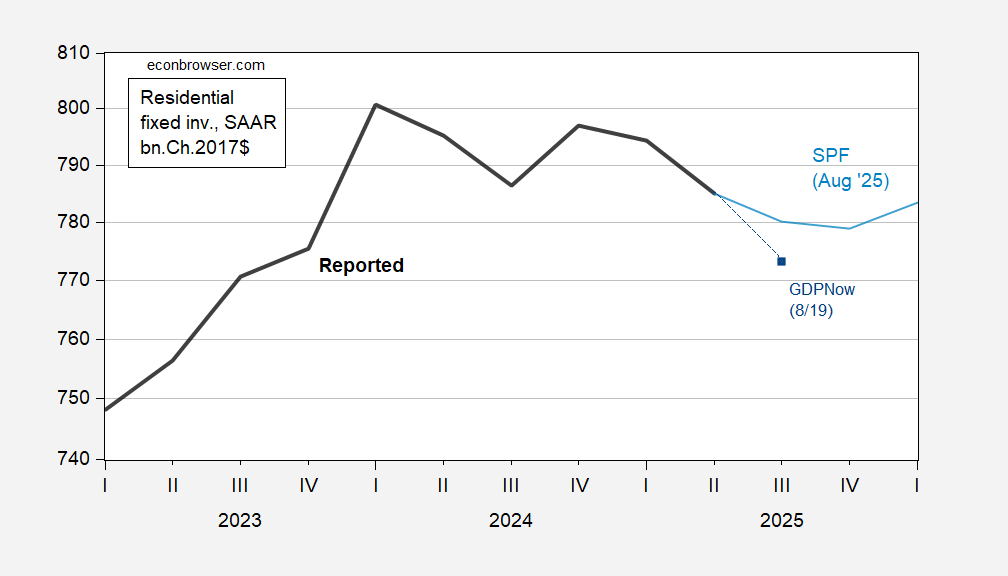
Figure 1: Residential fixed investment (bold black), Survey of Professional Forecasters August median f’cast (light blue), GDPNow of 8/19 (dark blue square), all in bn.Ch.2017$, SAAR. Source: BEA 2025Q2 advance, Philadelphia Fed, Atlanta Fed, and author’s calculations.
The nowcast undershoots noticeably the Survey of Professional Forecasters’ median, with responses from just a couple weeks ago.
Real 10yr interest rates and nominal mortgage rates are slightly below where they were in January 2025, so I’ll focus on policy uncertainty as a possible determinant of the decline in residential investment. (Although with housing prices declining according to the S&P Case-Shiller index, the real interest rate so defined has risen.)
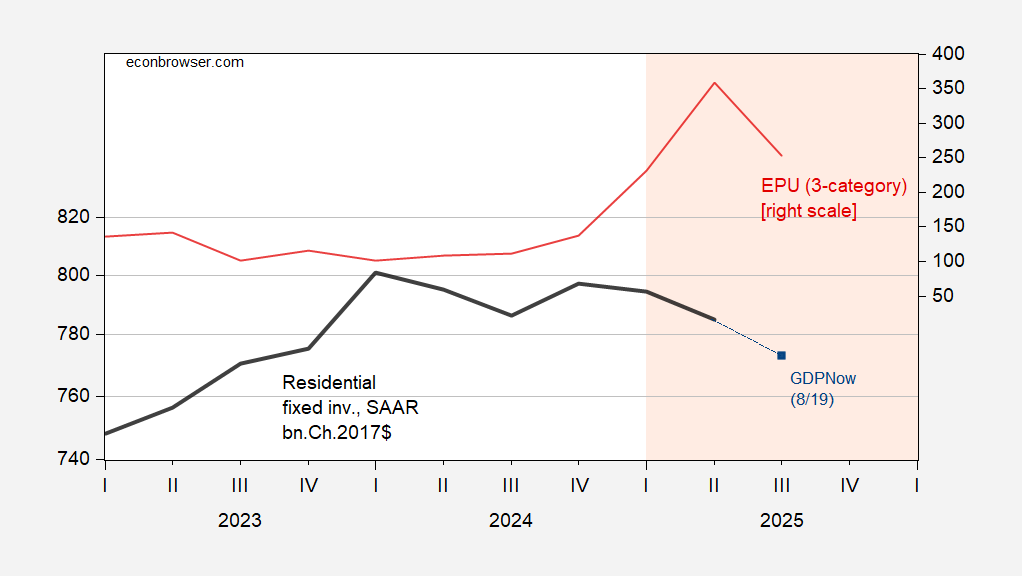
Figure 2: Residential fixed investment (bold black, left scale), GDPNow of 8/19 (dark blue square, left scale), both in bn.Ch.2017$, SAAR, and EPU (3 category legacy series), (red, right scale). Q3 EPU is for July. Light orange shading denotes Trump 2.0 administration. Source: BEA 2025Q2 advance, Atlanta Fed, policyuncertainty.com, and author’s calculations.
GDPNow registers 2.3% q/q AR growth for Q3, down from 2.5 last release. Goldman Sachs tracking as of yesterday was 1.4%.
It’s looking like non-residential and multifamily construction is also due for a slowdown, based on occupancy data:
“The overall hotel occupancy rate decreased by 1.4% year-over-year in Q2, as supply growth of 0.8% outpaced a 0.6% decline in demand.”
https://www.cbre.com/insights/figures/q2-2025-us-hotel-figures
“The national multifamily vacancy rate ticked up to 7.1% this month, setting a new record for our index. We’re past the peak of a multifamily construction surge, but the market is still absorbing all of the new units, and vacancies are still trending up.”
https://www.apartmentlist.com/research/national-rent-data
Meanwhile JLL reports the office vacancy rate at 22.6%, a new high, though some regional markets are turning. Not much call for new office construction in general.
“Demand for retail space remained soft in the second quarter of 2025 as net absorption was -6.5 million square feet (msf). While this was a marginal improvement from the -7.1 msf of space given back in the first quarter, this two-quarter stretch remains the weakest performance since 2020.”
https://www.cushmanwakefield.com/en/united-states/insights/us-marketbeats/us-shopping-center-marketbeat-report
There’s more to “housing”, or rather building construction in general, leading economic cycles than just the response to interest rates. There’s a natural boom-and-bust in response to demand. Once occupancy rates flatten out in response to new units coming on the market, new construction slows. That happens regardless of the interest rate environment, though rates have a hand, as well. We appear to be past the peak in malls, hotels and apartment buildings, and never had much need for a peak in office construction.
Here’s a comparison of residential fixed investment vs all other fixed investment, as shares of GDP:
https://fred.stlouisfed.org/graph/?g=1LDjt
The latest reading on residential fixed investment is 4.0%, vs 13.9% for nonresidential. Despite the larger size of nonresidential investment, the cyclical swing in the two is roughly the same; housing is really important for its size.
Meta is dowsizing its artificial intelligence effort:
https://www.nytimes.com/2025/08/19/technology/mark-zuckerberg-meta-ai.html
Don’t know what that implies for investment. Perhaps it will free up cash for more capital investment, but it looks like “investment” for Meta is now going to skew more toward acquisition and licensing – not a net gain for the economy. If this is a sign that Zuck thinks the AI budget has gotten out of hand, it could mean an outright drag on investment.
If other efforts are kicking Zuck’s butt, then his decisions may not tell us much about the overall direction of investment in the sector.