Today we are fortunate to present a guest post written by Pascal Michaillat (UCSC).
Is the U.S. economy in a recession? While economists debate and official announcements lag, a new algorithm that I have developed, based on a systematic analysis of labor market data, gives a 71% probability that the US economy was in a recession as of May 2025. The recession might have started as early as late 2023 or mid 2024.
Timely recession detection is critical for an effective policy response, yet the official declaration from the NBER’s Business Cycle Dating Committee often arrives up to a year after a recession has begun. Intriguingly, while the NBER’s webpage prominently displays the US unemployment rate over time, the explanation of how recession dates are determined does not mention that the dating committee uses the unemployment rate at all. For policymakers, businesses, and households who need to make decisions in real time, this delay is impractical. But existing real-time indicators that track the unemployment rate, like the Sahm Rule, provide valuable early signals.
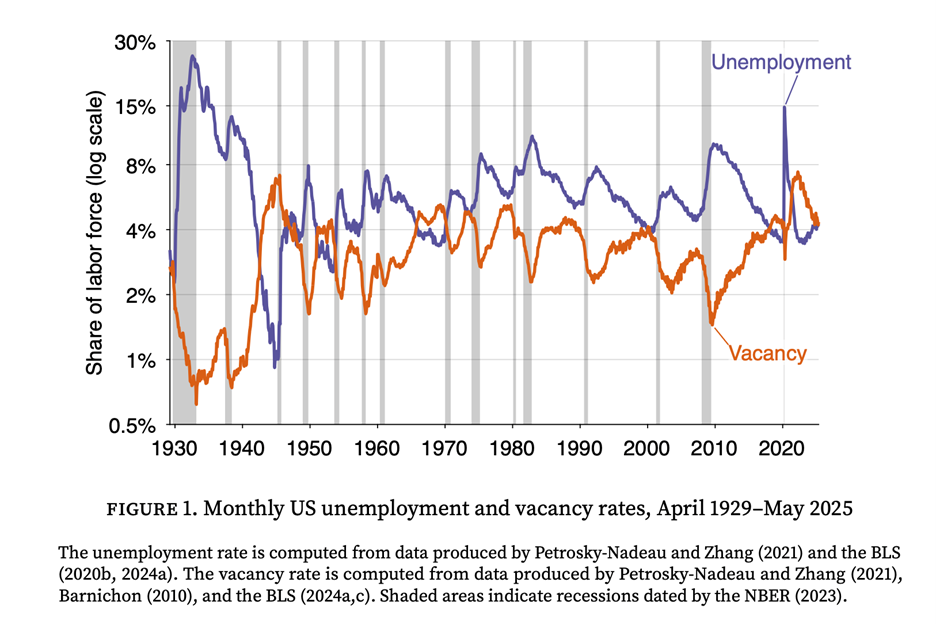
However, the Sahm and related rules are based on a single, sometimes noisy, measure of the economy. This algorithm builds on the insight that combining labor market data can create a less noisy, more powerful signal. In previous work with Emmanuel Saez, we developed a rule that combined unemployment and vacancy data to detect recessions more quickly and robustly than indicators based on unemployment alone. The foundation of this work is the Beveridge curve: at the onset of every recession, unemployment rises sharply just as job vacancies fall.
This new algorithm takes the next logical step: instead of using one specific formula to filter and combine the data, it systematically searches for the optimal way to do so. The goal is to find the best possible lens to view this data.
The algorithm first generates millions of potential recession classifiers, each processing the unemployment and vacancy data in a unique way, and each using a unique recession threshold. The algorithm then subjects them to a simple but demanding test: to survive, a classifier must identify all 15 US recessions from 1929 to 2021 without a single false positive. This test leaves us with over two million historically perfect classifiers.
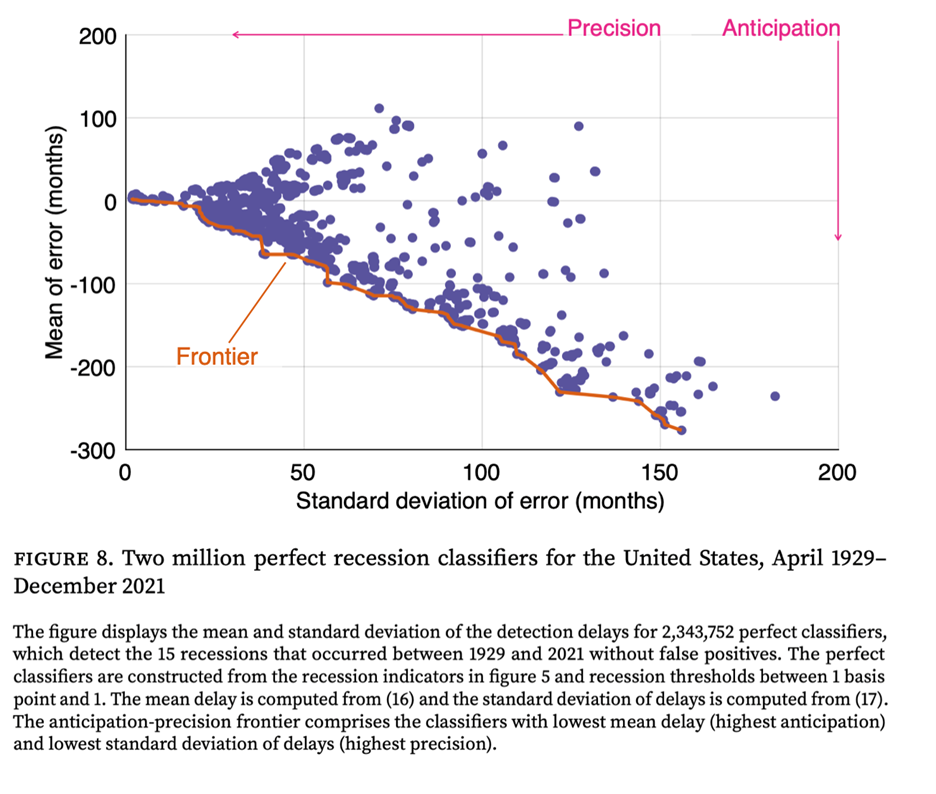
Having millions of perfect classifiers creates a new challenge: which one to choose? To solve this, the algorithm evaluates classifiers on two key dimensions: how early they detect a recession (anticipation) and how consistent that signal is (precision). By plotting each classifier’s average detection delay against the standard deviation of the detection delay, the algorithm identifies an anticipation-precision frontier—a group of elite classifiers that offer the optimal trade-off between speed and accuracy. For any given level of precision, no classifier is faster than one on this frontier. From this frontier, the algorithm then selects an ensemble of 7 top-performing classifiers. These are all the classifiers whose detection delay’s standard deviation is below 3 months—which guarantees that the width of the 95% confidence interval for the estimated recession start date is less than 1 year.
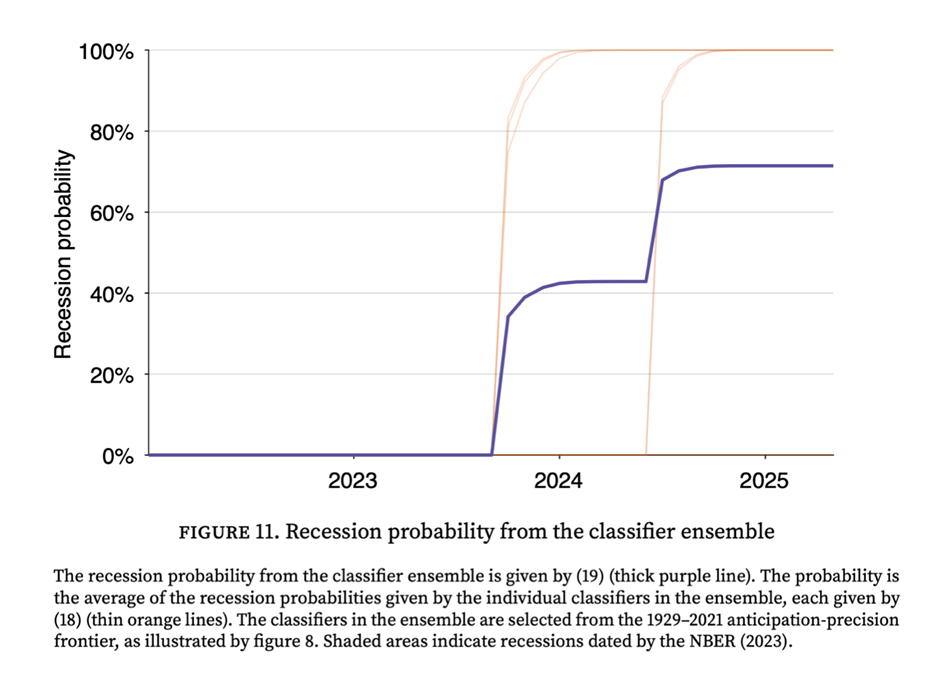
This classifier ensemble provides a single, real-time recession probability. In every historical recession since 1929, the probability rises sharply near the downturn’s start and stays high until it ends. When I apply the model to the most recent data, it says that the probability of a recession has surged to 71% as of May 2025. This is not a statistical abstraction; it is a direct result of the weakening of the labor market. Since mid-2022, the combination of rising unemployment and falling vacancies has triggered 5 of the 7 classifiers in the ensemble, pushing the recession probability up. The recession probability first became positive late in 2023, when 3 of the 7 classifiers got triggered. The recession further increased in mid 2024, when 2 additional classifiers got activated. Currently, only 2 of the 7 classifiers in the ensemble are inactivated.
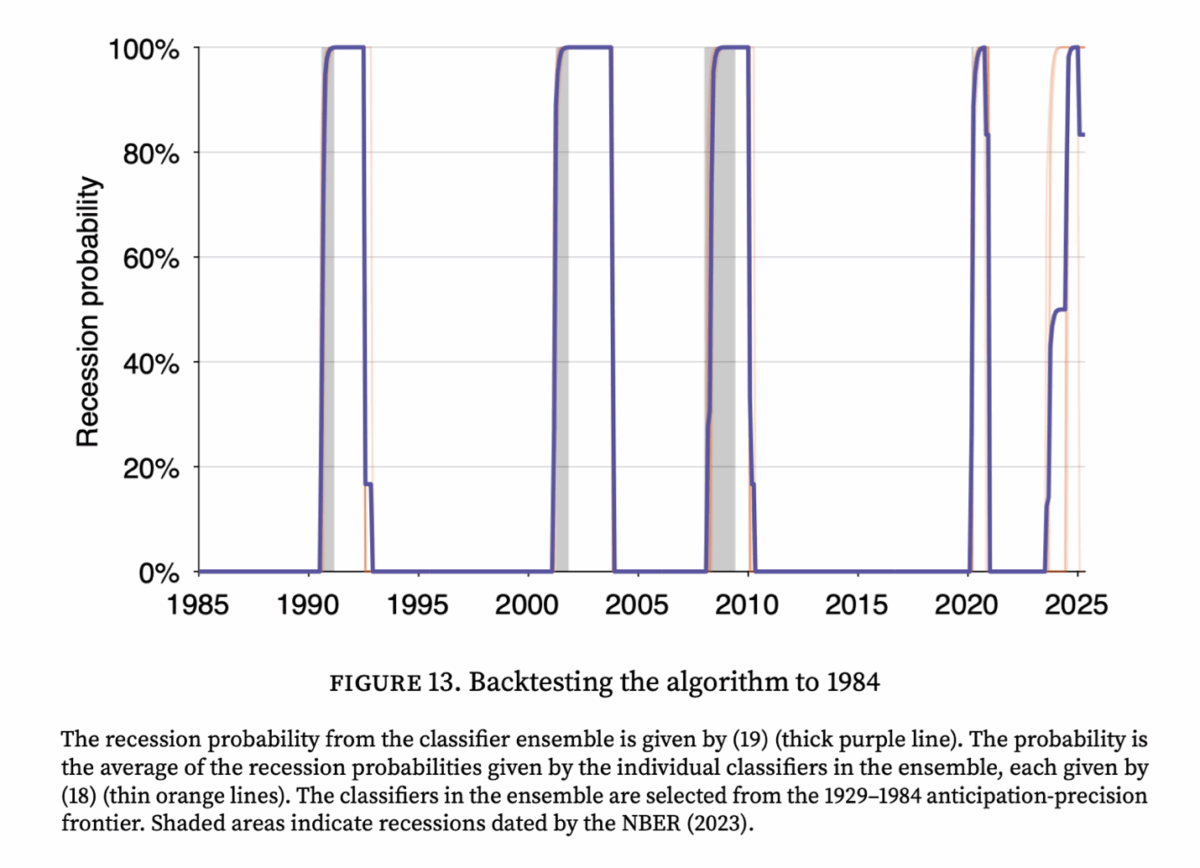
To verify the model’s reliability, I performed a series of backtests. For instance, I trained the algorithm using data only up to December 1984 and asked it to detect all subsequent recessions. All the classifiers in the ensemble built from 1929–1984 data did very well, correctly identifying all four downturns in the 1985–2021 test period—including the dot-com bust and the Great Recession—without any false positives. Most impressively, even without seeing any data past 1984, the classifier ensemble detected the Great Recession in good time, with its recession probability surging by the summer of 2008, providing a clear and timely warning. In fact, The performance of the algorithm over the entire testing period, 1985–2021, is surprisingly good. Over the 4 recessions of the testing period, the standard deviation of delays averages only 1.4 months, and the mean delay averages only 1.2 months. The classifier ensemble trained on 1929–1984 data assigns a recession probability of 83% to current data (5 of the 6 classifiers in the ensemble are currently triggered).
Overall, this new algorithm shows that the labor market is sending an unambiguous signal: the conditions characteristic of a recession are not on the horizon—they are already here. If it turns out, once the dust has settled, that the US economy is not in a recession: what would we learn? In that case, the algorithm could be retrained on the new data, and the classifiers that mistakenly detected the recession would be eliminated. However, given that many of the classifiers on the frontier do signal a recession, the anticipation-precision frontier would shift out. We would therefore learn that detecting recessions with labor market data is harder than we previously thought.
This post written by Pascal Michaillat.
We recently were treated to the assertion that imported goods prices continue to rise more slowly than prices of domestically manufactured goods, despite tariffs, based on a mystery-meat data series concocted in part from 7 year old input-output data:
https://econbrowser.com/archives/2025/07/cea-imported-goods-have-been-getting-cheaper-relative-to-domestically-produced-goods
The authors, working under Kevin Hassett (whose difficulty with math is well established), didn’t show their work, and their results were at odds with evidence, theory and common sense. Turns out, there is already good research published on this very same subject, in which the authors do show their work:
“Tracking the Short-Run Price Impact of U.S. Tariffs” by Cavallo, Llamas and Vazquez
https://www.hbs.edu/faculty/Pages/item.aspx?num=67299
Rather than cooking up a data series using outdated I-O tables, Cavallo and friends rely on actual firm-level price data. They find the same decline in the price trend of imported relative to domestically made goods prior to the felon-in-chief’s 2nd-term tariffs as does Hassett, but a sharp increase in imported goods prices during the felon’s 2nd term. Again, that finding is based on actual firm-level prices. The same firm-level data was available to Hassett, but he and his minions chose to cook up their own mystery-meat data series instead. Hassett looked at data through May, Cavallo at data through July 15. Both published in July – Hassett looked for an identifiable change in trend based on at most two months worth of data. Can’t get much worse than that.
And by the way, Cavallo and friends published an earlier version of this paper in May, so Hassett had plenty of time to know about the paper and its data source. He ignored it.
Macroduck: Just a minor clarification. The mystery meat approach is beyond Hassett. The analysis was conducted under Dr. Miran.
Meow?
As Michaillat notes, the Beveridge curve and related ideas have been used to assess recession odds for some time. For those who’d like to play along, but don’t have the computing power to run millions of tests, the FRED folk offered this about a year ago:
https://fredblog.stlouisfed.org/2024/07/the-job-openings-to-unemployment-ratio-labor-markets-are-in-better-balance/
And BLS tracks openings vs unemployment monthly:
https://www.bls.gov/charts/job-openings-and-labor-turnover/unemp-per-job-opening.htm
Here’s Michaillat’s Figure 1, truncated to show recent performance more clearly:
https://fred.stlouisfed.org/graph/?g=1KLcg
Could there have been a recession signal back in 2018/2019? There certainly were some worrying signs eslewhere in the economy around that time. If a recession was on the way before Covid struck, then analysis of business cycles which includes the Covid recession might not be as messed as we’d think.
The problem with any forecasting or nowcasting system is that structural change can make once-useful signals no longer useful. Claudia Sahm has pointed out potential problems with her rule, due to swings in immigration. There have also been suggestions that a change in job-posting behavior among firms has distorted openings numbers:
https://www.forbes.com/sites/jackkelly/2023/04/04/how-fake-job-postings-may-distort-the-us-jolts-report/
Swings in immigration and changes in job listings represent structural changes in the data Michaillat uses in his algorithms. Multiple sets of rules combined to form a composite rule might reduce the effect of such structural changes, though it would take someone smarter than me to see how that would work.
Michaillat tells us that his algorithms indicate we may have been in recession since 2023. Politics aside, doesn’t that suggest a problem? Have the combined algorithms shown a high probability of recession for any similarly long period when NBER hasn’t declared a recession? Or when consumption or sales tax or jobless claims data have been equally strong?
Here’s the truncated version of Figure 1 again, with the y/y change in initial jobless claims added in:
https://fred.stlouisfed.org/graph/?g=1KLg2
I don’t see evidence of recession in 2023 or 2024 in the claims series. So, are we getting false signals from U3 and job openings in the Covid expansion? Are the claims data missing something?
I’m not saying we aren’t in recession, just that we ought to be aware of the possibility that the many oddities of the Covid era – ridiculously brief recession, lock-down, massive stimulus, epic supply-chain disruptions, huge immigration interspersed with vigorous episodes of anti-immigration activity – could mean “this time is different”.