In commenting on my post yesterday on house affordability, Bruce Hall brings my attention to this Supermoney article by Andrew Latham, which states:
…the price per square foot has remained pretty stable [from 1978?] right until 2020. Look at the price per square foot (inflation-adjusted) for new homes in the graph below.
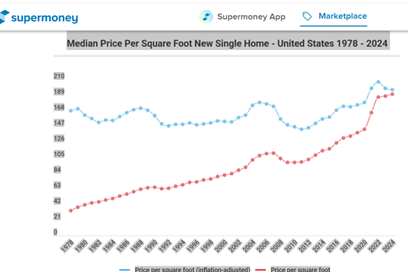
Well, we’re not in 2020; to the best of my knowledge, we’re in 2025. Even in Latham’s graph, the increase in the inflation adjusted price is 6.5% from 1978 to 2020; it’s 22.5% through 2024.
I don’t have data back to 1978, but I do have data back to 1992. I plot median square foot price (detached) divided by CPI-ex shelter (so this is a “relative price” rather than a real*), and by median usual weekly earnings.
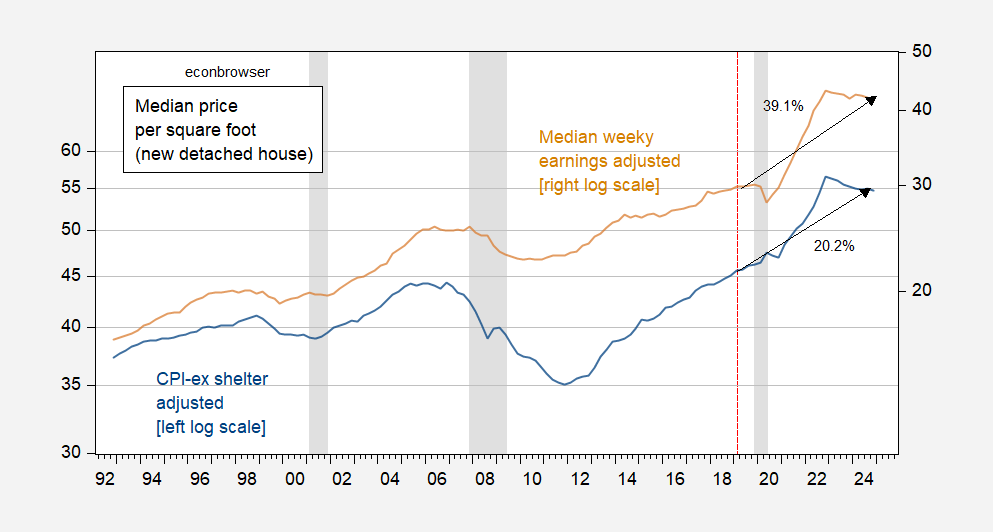
Figure 1: Median price square foot detached houses sold deflated by CPI – ex shelter (blue, left log scale), median price square foot detached houses sold normalized by median usual weekly earnings (tan, right log scale). Median price per square foot linearly interpolated from annual data. NBER defined peak-to-trough recession dates shaded gray. Source: Census Bureau, and BLS via FRED, NBER, and author’s calculations.
Figure 1 also addresses Steven Kopits‘ assertion that I have “cherry picked” normalization dates (2012Q1) to accentuate the price increase, and suggests 2019. What I was attempting to do was to show the increase over the house price cycle. However, one can plainly see that switching to 2019Q1 as a normalization date does not change the overall story that house prices (in square feet) have changed substantially. (Since the series are plotted on log scales, just draw an arrow from 2012Q1 and see if the slope changes much.)
* Shelter is a very large component of the CPI, so dividing by CPI all urban is kind of like dividing house prices by, in part, implicit house prices. Hence, I divide by CPI ex-shelter, which in log first differences approximates the HICP for the United States that Bruce Hall mentions in his comment.
I appreciate this analysis.
Just a reminder that it’s a rhetorical trick to compare the median earnings to the price of a new house over time. Of course you know about the period of time in the U.S., where it was common for a middle-class family to afford a new house. This hasn’t been true for all of the 20th century and certainly not for the 21st. Aside from the Supermoney rebuttal, wouldn’t it be more useful to compare median income to another housing metric that includes more than 1-2% of the total housing market in any given year?
2019 starting point is good.
I think we will see reversion to mean on house prices, so a substantial decline. This has already started in the south and mountain states, and to an extent, California. So far, the Northeast and Midwest are holding up, but I think we’ll see corrections in 2026 there, too. And I think the corrections will be large.
Can this be accomplished without a recession, or indeed, a depression? That’s an analysis I’d like to see.