I don’t have a resolution to the debate, but I have an insight, regarding per capita series (which is different from aggregate statistics used to determine a recession), summarized in a couple graphs.
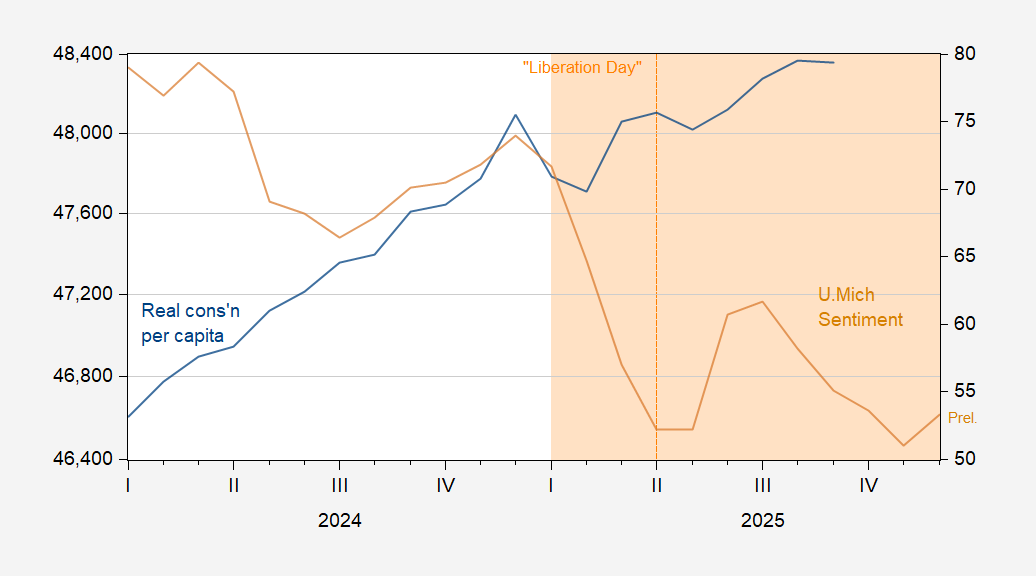
Figure 1: Real consumption per capita, in Ch.2017$ SAAR (blue, left log scale), and U.Michigan Consumer Sentiment (tan, right scale). FRED population series POPTHM used to calculate per capita consumption. December Sentiment in preliminary. Source: BEA via FRED, U.Michigan Survey of Consumers, and author’s calculations.
Note that not only has consumption per capita flatlined, per capita real retail sales is now below November 2024 peak.
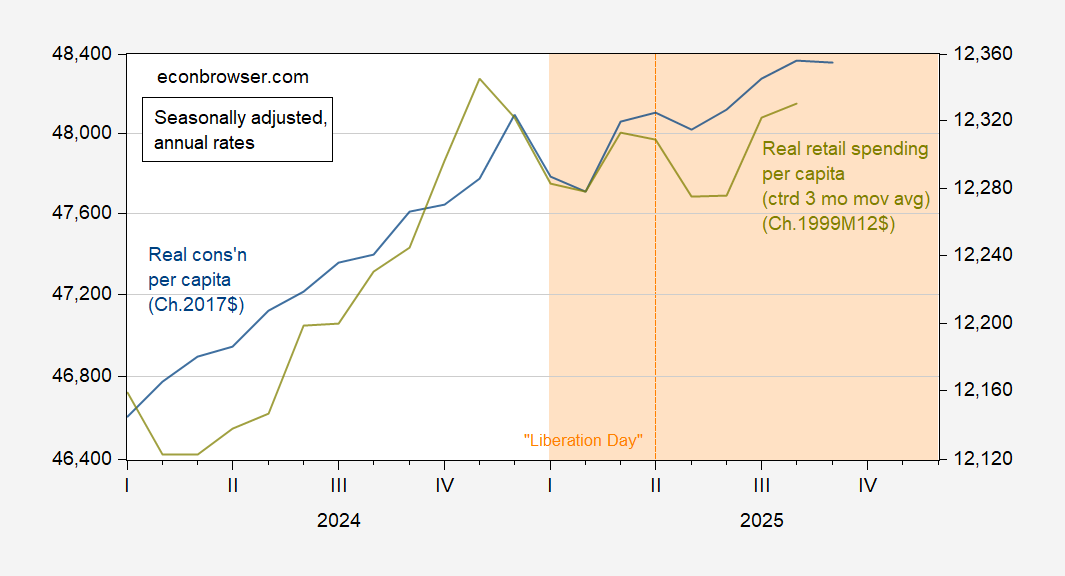
Figure 2: Real consumption per capita, in Ch.2017$ SAAR (blue, left log scale), real retail sales per capita, in Ch.1999M12$ (chartreuse, right log scale). Retail sales series deflated using chained CPI, seasonally adjusted by author using X-13. FRED population series POPTHM used to calculate per capita series. Source: BEA , BLS via FRED, and author’s calculations.
Falling employment and rising prices help account for softening real per capita spending.
The flatlining of per capita real retail sales and the slower growth of per capita real consumption come in the context of slow population growth and increased efforts to limit immigration; the problem of weakening per capita spending is compounded by other factors that are weakening overall consumer demand.
New Deal democrat has pointed out that consumer spending on services is looking less resilient than usual:
https://econbrowser.com/archives/2025/12/deceleration-in-nowcasted-final-sales-to-private-domestic-purchasers-gdp#comment-321719
This is an oddity that needs to be better understood in detail – is it mostly discretionary service spending that’s being foregone? Or perhaps “necessities” like insurance and education? Maybe slack foreign tourism is showing up as weaker demand for services. I’m gonna check if no one beats me to it.
I’m going for a bike ride, so anyone who wants to beat me to it has a head start.
It’s real spending on goods that typically peaks, while services sail right along.
And here is per capita real spending on goods since 1959:
https://fred.stlouisfed.org/graph/?g=1OBxa
Typically the three month moving average stalls, if not turns down, at least 6 months before a recession. As I wrote Friday, it was on the cusp of doing that in September (the last data reported).
I think I can confidently say that we would be in a recession now except for spending fueled by stock market gains. But that wealth effect with spending by the top 10% has been very potent – so far.
This is a statistic I have quite a lot of familiarity with. I consider real retail sales per capita a good long leading indicator, because the data goes back over 70 years, and since then about half the time it peaks 12 months or more before a recession, and almost always peaks at least 6 months before. Here’s the link where you can judge for yourself:
https://fred.stlouisfed.org/graph/?g=1OBh6
It isn’t perfect, and in fact we had a false positive in 2022-23, when the signal was swamped by the massive deflation in commodity prices (a huge positive supply shock).
There was a secondary peak last December, and 9 months of reported data since.
The failsafe is to compare this with real personal spending on goods (a similar but broader measure), which as we found out Friday May also have peaked.
We also have housing construction (long leading indicator) and heavy truck sales off at recessionary levels.
I still want to see (1) non-stale data on new orders for durable goods, including consumer durables, and (2) whether the advance-decline line suggests the AI-related stock price boom (fueling wealth effect spending) is faltering.
Attorney General Bondi has ordered the FBI to link groups which “advance political and social agendas, including opposition to law and immigration enforcement; extreme views in favor of mass migration and open borders; adherence to radical gender ideology, anti-Americanism, anti-capitalism, or anti-Christianity,” to terrorism:
https://www.reuters.com/legal/government/bondi-orders-law-enforcement-investigate-us-groups-over-accusations-domestic-2025-12-05/
There is, of course, almost no domestic terrorism in the U.S. apart from:
– the right-wing militia movement
– bombers of family planning clinics
– bombers of black, jewish and muslim houses of worship and
– a handful of MAGA goons.
No organized pro-gay violence. No organized pro-immigrant violence. No organized pro-civil rights violence. Noo organized voting rights violence. This an effort to criminalize dissent – you know, like Stalin, Pol Pot, Mao and Hitler did. The same tactics used to terrorize immigrants will now be used against the rest of us.
Meanwhile, the annual gathering of the American Renaissance Conference, a white nationalist organization, is underway in (of course) Tennessee:
https://www.newschannel5.com/news/newschannel-5-investigates/confronting-hate/advocates-for-political-violence-among-those-welcomed-to-conference-at-tennessee-state-park
As the local TV news points out, many of the leaders of Renaissance are vocal advocates of violence. I have little doubt some of the attendees were among the January 6 insurrectionists. These are not, however, the people Bondi wants to investigate.
Professor Chinn, I apologize for reaching out to you this way. I’m with Scholars Strategy Network and would like to have you on the No Jargon podcast. I’ve sent the details to your school email address, but in case it got lost, I’d be happy to share them another way. Would you be interested in joining us in January? Thank you!
China has bought a quarter of the soybeans it promised trump to end trade war. So now trump will give $20 billion handout to farmers in welfare. And china can now buy top nvidia chips. This is called winning with trump? What a chaotic failure.