A staple of mid-1980’s investment modeling, q-theory was an alternative to the Keynes’ marginal efficiency of capital or Jorgenson user cost of capital approaches. A version of q –the ratio of market value to replacement value of a corporation’s capital — was central in Summers’ 1981 BPEA paper modeling corporate investment behavior. And yet, q-theory is now almost completely absent from recent discussion of the level of capital investment (in contrast to the debate nearly two decades ago). Why? First a picture of q, the market price relative to replacement cost of physical capital.
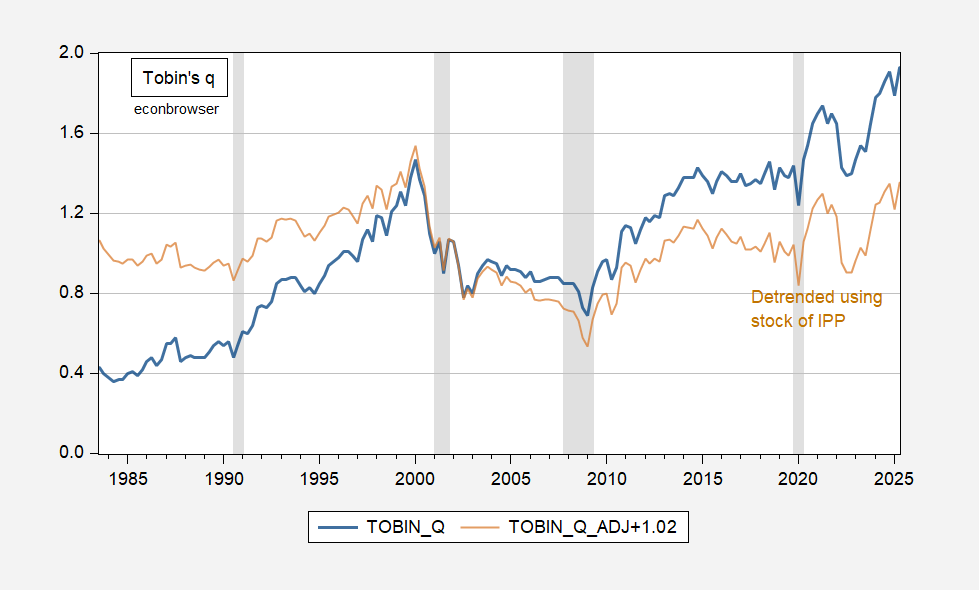
Figure 1: Tobin’s q (blue), and detrended Tobin’s q (tan) for the nonfinancial corporate sector. Detrended q calculated by regressing Tobin’s q on stock of intellectual property products, linearly interpolated from annual data. NBER defined peak-to-trough recession dates shaded gray. Source: Fed Flow of Funds via FRED, BEA, NBER, and author’s calculations.
Tobin’s q is closing in on 2 in 2025Q2, while it only reached about 1.5 at the peak of the dot.com boom.
Chirinko (JEL, 1993) reviews the various models of investment, and of q, notes that average q (which can in principal be calculated) equals marginal q (which is unobservable) if (1) markets are perfectly competitive, (2) production and adjustment cost technologies are linearly homogeneous, (3) capital is perfectly homogeneous, and (4) investment decisions are largely separate from other real and financial decisions.
Needless to say, in an era of AI and some capital is intangible, average q is likely to be mismeasured, and even more unlikely to be representative of marginal q. Assuming the degree of mismeasurement of average q is due to intangibles which can be proxied by intellectual property products (IPP), R&D and software (BEA [1] [2]), then one obtains the measure shown as the brown line in Figure 1. (It should be noted that the rate at which intangibles depreciate is unclear, depending on innovation and excludability (Crouzet et al., 2022), so the net impact on the intangibles capital stock is unclear; also IPP does not include “organizational capital” etc.)
In 2025Q2, detrended q is then lower than it was in 2000Q1 (1.35 vs. 1.54). I’d like to say this means the market’s valuation of the capital stock is not excessively high, but in actuality detrending using log stock of IPP is pretty close to linear (deterministic) detrending, and this is a dangerous thing to do when q looks like an I(1) process (one can’t reject the null hypothesis of unit root).
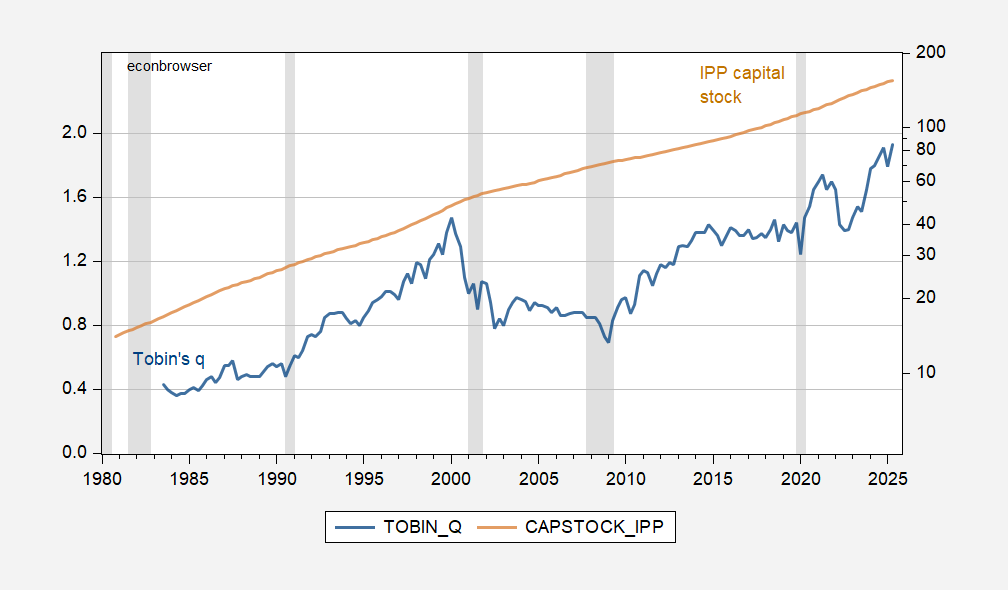
Figure 2: Tobin’s q (blue, left scale), and log stock of intellectual property products (tan, log right scale) for the nonfinancial corporate sector, linearly interpolated from annual data. NBER defined peak-to-trough recession dates shaded gray. Source: Fed Flow of Funds via FRED, BEA, NBER, and author’s calculations.
So, we are forced to look elsewhere for insights into what the level of investment should be (forward P/E’s or CAPE maybe).
If there is any realism to Tobin’s (and Kaldor’s) assumption about replacement value being an anchor for market value, the historic average of q ought to be around 1. In fact, the historic mean for the U.S. stock market is 0.970, the median 0.940. Pretty good shootin’:
https://dqydj.com/tobins-q/
Since the graph at the above link doesn’t appear to be working, here’s another:
https://www.gurufocus.com/economic_indicators/99/tobin-q
The persistence of the average of q requires an undershoot for every overshoot – that’s how math works. The chart shows that’s more or less true, though the average appears to be rising in the era of increasing business concentration. The implication is not just that today’s valuations will revert to roughly the replacement value of capital, but that they’ll undershoot…by a lot.
If I’m reading correctly, Menzie’s figures represent all capital investment – we’re looking at a mix of AI-related investment, which has been extraordinarily strong, and all other capital investment. As reflected in the title, we are looking at the effect of AI investment on aggregate investment.
I have to wonder, since Tobin’s q should apply to individual shares and across sectors, as well as to the entire equity market, doesn’t Tobin’s idea mean that AI-related shares are in for one hellacious dump?
Does a longer history do us any good in assessing whether the AI spending binge must end in tears? If one were to look at the period of railroad or automobile or computer expansion in the U.S., would we see similar patterns? We know that each of these cases of massive investment in new technology involved a painful resource reshuffling once the build-out was complete.
And finally, doesn’t the failure of the rest of the equity market to rise in response to the rise of AI-related shares imply that AI shares are overvalued? If AI is going to lead to a flowering of growth, shouldn’t that be reflected in the growth prospects of the average firm? If the rest of the business world doesn’t stand to benefit from AI adoption, where will AI make money? If other firms will benefit, why aren’t their shares rising as AI develops?
Two kinds of AI stocks:
1. Chip designers/sellers like NVIDIA, lesser recognized are Google and Amazon who design chips and also build data centers. These are somewhat bubbling and may parallel some of the dot.com, telecom bubble.
2. AI application venders, who pay for compute from big data centers or like OpenAI (OpenAI not IPO, yet) sell generative AI and buy NVIDIA chips to build their own data centers. There may be a special vehicle between NVIDIA and OpenAI, which looks like a feature of the telecom bust.
The AI sellers are mostly very low margin, and a lot of AI retail pricing does not cover compute nor training.
Data centers are huge capital, heavy operating costs and the advent of new tech suggests too early scaling makes an obsolescence cycle trouble for pay debt.
There is already a CDS market for AI related debt.
I have acquaintances who were affected by the dotcom and telecom busts.
The AI universe can mature, but margins are not going to stay up.
There is already a lot of competition in both chips/data center design and as well as a large cadre coming on to compete in AI sellable retail SW.
I think a lot of AI SW is over promising.
CDS for AI? Indeed:
https://thetradable.com/ai/orcl-cds-spread-doubles-to-120-basis-points-as-aidriven-credit-risk-surges–v
The headline writer should be fired. He/she missed an opportunity to be both sensationalistic and factual: Oracle’s CDS cost didn’t just double, it tripled.
Here’s more gloomy reporting on AI CDS performance:
https://m.economictimes.com/news/international/us/credit-default-swaps-spike-some-ai-firms-now-riskier-than-banks-before-the-2008-crash/articleshow/125387752.cms