Up for geopolitical risk, not for financial.
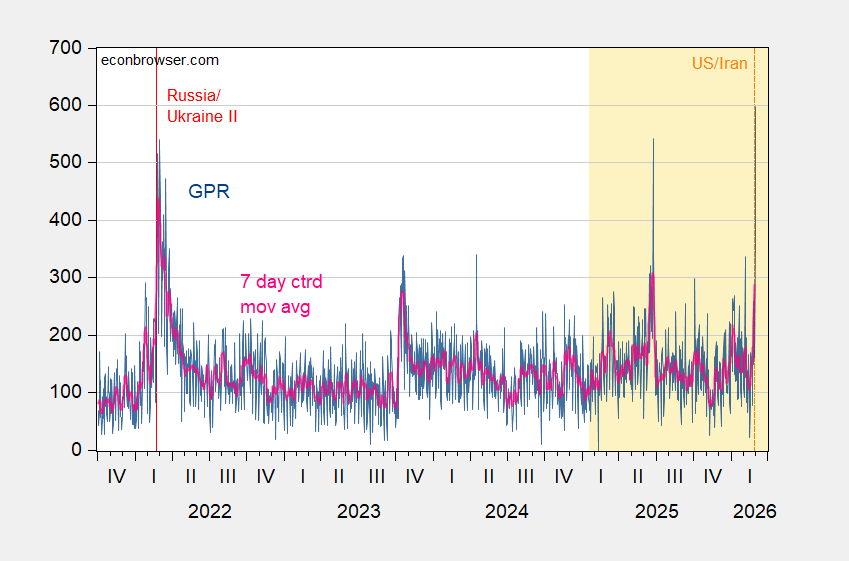
Figure 1: Geopolitical Risk (GPR) index (blue), 7 day centered moving average (red). Source: Caldara et al.
Here are the subcomponents of GPR, GPRD-Action, GPRD-Threats.
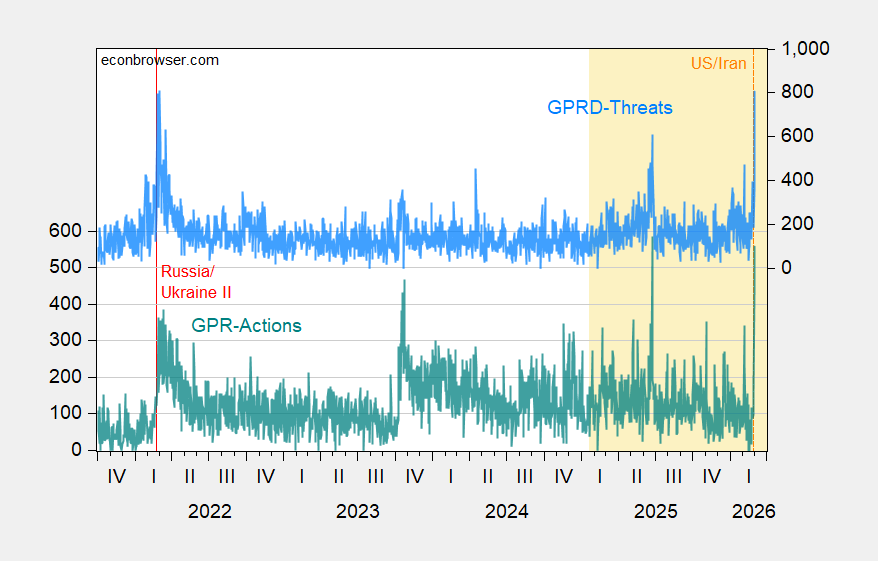
Figure 2: Geopolitical Risk Action index (teal), GPR Threats (sky blue). Source: Caldara et al.
Economic policy uncertainty and financial risk are not similarly elevated, thus far (through 3/1 for EPU, through 3/2 noon CT for VIX).
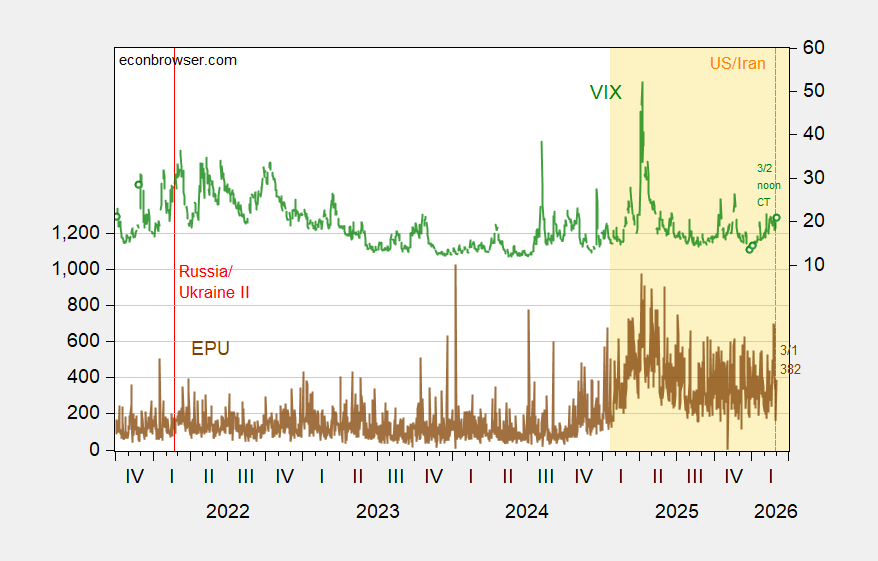
Figure 3: EPU (brown, left scale), VIX (green, right scale). Source: policyuncertainty.com, CBOE via FRED.
That being said, elevated GPR and EPU both rose with slowing economic activity, as illustrated in this post.
Interesting – Today, the Institute for Supply Management reported that Manufacturing PMI: 52.4 (second month of expansion) and Prices Paid: 70.5 (highest since 2022 inflation peak). Typically a Prices Paid reading above 70 historically signals rapid cost acceleration at the factory gate. During the 2021–2022 inflation surge, ISM Prices Paid led CPI by ~2–4 months. It tends to lead PPI first, then core goods CPI. There is pressure building in the pipeline. importantly, the survey responses were collected before the airstrikes and oil spike.