From EJ Antoni (first published two weeks ago):
First, 2025 was a year of transition for the economy. Under Democrat President Joe Biden, particularly his last two years in office, job growth was disproportionately due to government hiring. Similarly, government purchases played an outsized role in growing overall economic activity, as measured by gross domestic product (GDP). …
The second element is the distinction between inflation and prices….
But notice that the mile markers aren’t going down even when there’s no inflation. That’s nearly where we’re at today, with real-time inflation metrics like Truflation showing an inflation rate well below 1%, about as good as it gets outside of a recession.
Even if Congress doesn’t act, the good news is that income growth is helping solve the problem, albeit more slowly, and that’s the third element which has changed significantly in the economy.
Under Biden, wages grew substantially, but prices rose much more rapidly. …
…the fourth element to understand, which is federal finance. Because the economy is growing faster, tax receipts to the Treasury are up 11.8% this fiscal year, compared to the same months in the prior fiscal year—which were the last four months of the Biden administration.
…
That brings us to the final element: investment. Between tax and regulatory cuts along with Trump’s trade negotiations, trillions of dollars in investment are pouring into the country. …
… After years in the doldrums, the finish line of prosperity is fully in sight.
On point 1, private employment grew faster in the last year of Biden than the first year of Trump. Since employment is graphed on a log scale, the flatter slope indicates slower growth.
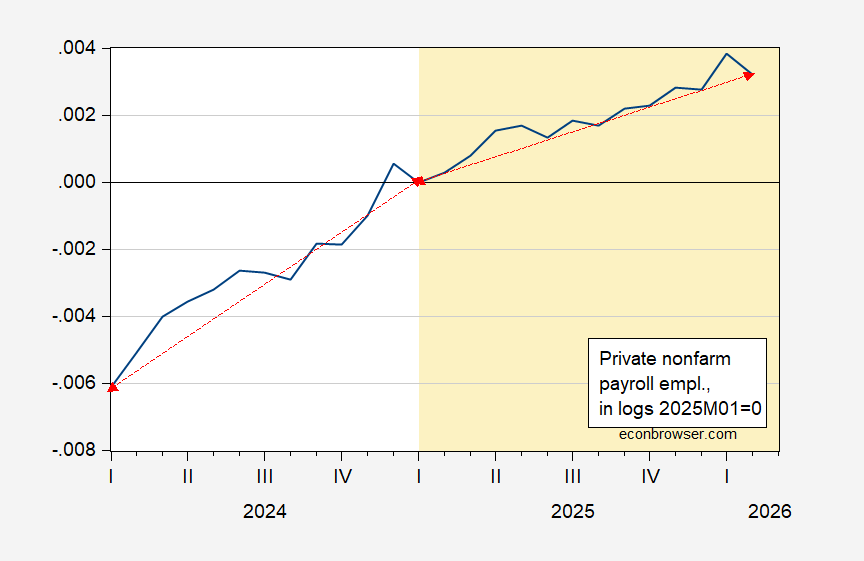
Figure 1: Private nonfarm payroll employment, in logs, 2025M01=0 (blue). Source: BLS.
On point 2, Truflation does indeed say 0.98% y/y inflation right now. For January, Truflation recorded 1.6% y/y inflation, while BLS reported 2.39%. (Cautionary note: Truflation’s CPI inflation series looks like this, in comparison to BLS, and Cleveland Fed’s nowcast; remember EJ Antoni is Truflation’s strategic adviser…)
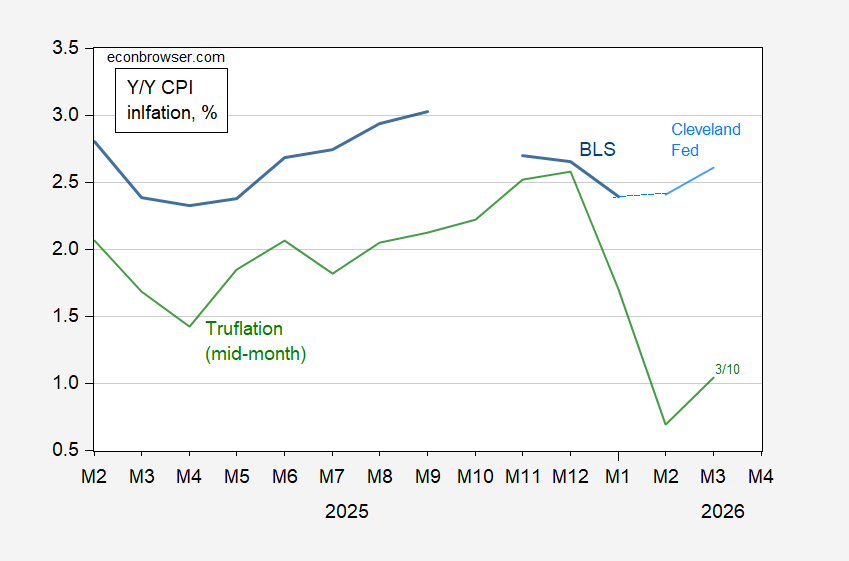
Figure 2: Year-on-Year inflation from BLS (blue), Cleveland Fed nowcast of 3/10 (sky blue), Truflation CPI inflation, mid-month reading (green), all in %. Source: BLS, Cleveland Fed, Truflation.
Pretty wild! Not all of the divergence between BLS and Truflation measures can be attributed to the treatment of housing. See also commentary on Truflation.
Moreover, inflation expectations have risen sharply since the US-Iran war began.
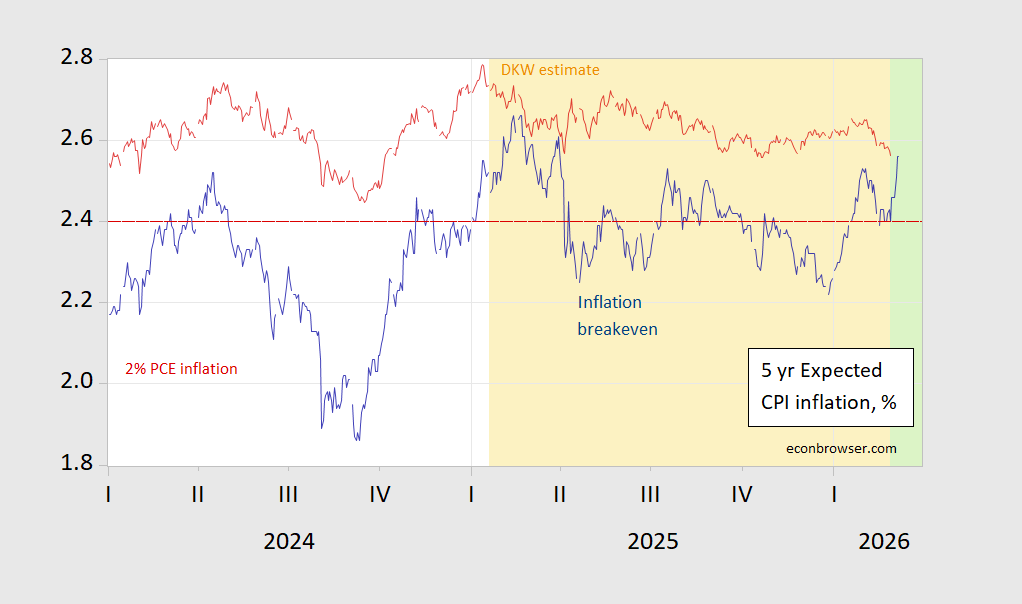
Figure 3: Five year inflation breakeven (blue), and DKW estimate of five year expected inflation (red). Red line at 2.4%, consistent with 2% PCE inflation. Source: Treasury via FRED, Fed/DKW, and author’s calculations.
On point 3, Median real wage earnings (as opposed to average hourly earnings) show slight deceleration, 2024Q4-2025Q3 vs. 2023Q4-2024Q4.
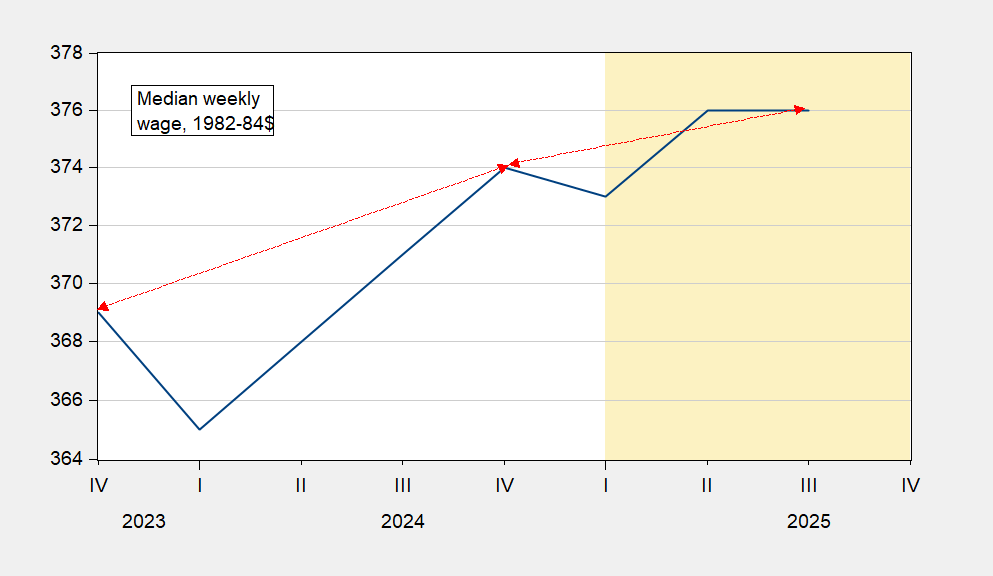
Figure 4: Median usual weekly earnings, in 1982-84$ (blue). Source: BLS.
On point 4, CBO finds that the deficit in February FYTD (fiscal year to date) is $1 billion greater in FY2026 than in FY2025… Taking out the IEEPA tariff revenue that the Supreme Court has ruled illegal, and International Court of Trade ruling that IEEPA tariff proceeds have to be refunded, well, I think we know where things are going in this calculation.
On point 5, “trillions of dollars of investment are pouring into the country”, I think such pronouncements are, to put it mildly, delusional. As PIIE has shown, the pledges strain credulity. Or see Shawn Donnan’s (Bloomberg) tabulation.
So… it may very well be the case that the US economy is ready to “blast off”, but I’d not hold my breath. Kalshi has taken the 2026 y/y GDP growth from 2.6% pre-Iran to 2.3% today.
I commented in a previous post, but got no answer. by its own admission, truflation resets in normalizing parameter at the beginning of each year. which means you cannot directly compare the end of year 1 with the beginning of year 2. at least that is what their website indicates. anybody got any further details on how it actually makes its calculations?
tariffs will need to be refunded, which will add to the deficit. and a recent study indicated that all of the tax refund my from the big bloated bill act will be offset this year by the oil price increase.
The economy is about to take off and inflation is 1%? That must by why dealers were stuck with 19.5% of today’s 3-year auction, the highest since investors ran for cover after “Liberation Day”. The long-run average for dealers at this maturity is arounf 10.5%. Cover ratio a thin 2.55.
Tens and bonds are auctioned tomorrow and Thursday. Debt-market oopsies are not generally kicked off by Treasury auctions in the U.S., but it has happened.
Meanwhile, corporate spreads have widened, with the timing clearly associated with the war on Iran:
https://fred.stlouisfed.org/graph/?g=1TiF4
Oh, and BlackRock capped withdrawals from a big private credit fund about 4 days ago.
So yeah, all the classic signs of an economy on the verge of a low-inflation growth surge.