Here’re quarterly and monthly GDP, normalized to October 2025:
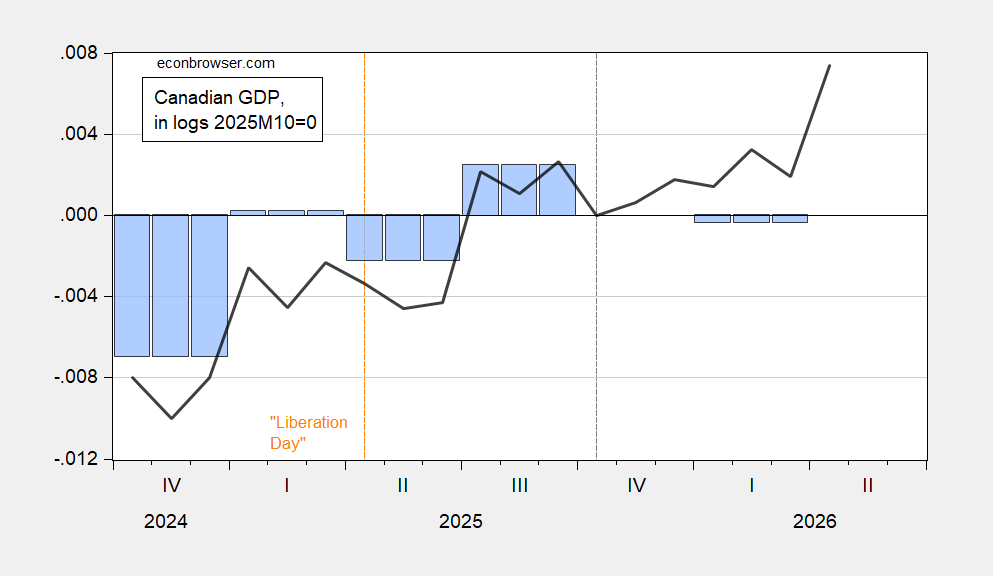
Figure 1: Canadian real GDP (blue bars), monthly GDP (black line), both in logs 2025M10=0. Source: StatCan, and author’s calculations.
The two series diverge as the quarterly series are based on expenditure side tabulations, while monthly relies on production side data.
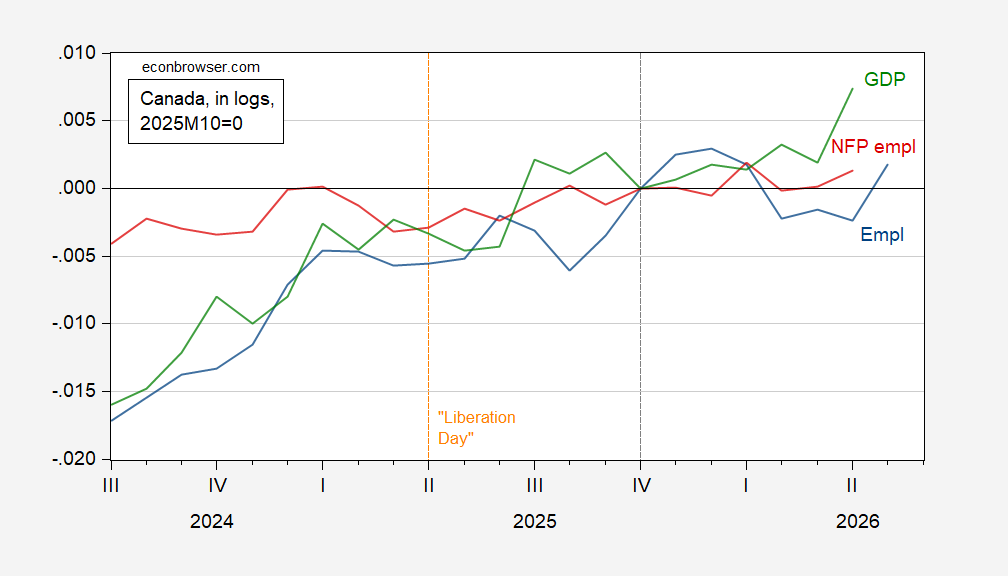
Figure 2: Monthly GDP (green), employment (blue), nonfarm payroll employment (red), employment +15yr (blue), all in logs 2025M10=0. Source: StatCan and author’s calculations.
Compare against the view in this post.
ScotiaBank‘s nowcast for Q2 is +2.3% q/q SAAR, while the Canadian Chamber of Commerce’s Business Data Lab nowcast is +5.04% (!), way above Bloomberg consensus.
Speaking of jobs data, some doubt has been expressed regarding Friday’s U.S. jobs report. Specifically, the 61,000 drop in leisure and hospitality employment while the World Cup is underway has raised eyebrows:
https://www.yahoo.com/finance/economy/articles/on-wall-street-analysts-increasingly-dont-believe-the-us-governments-misleading-job-numbers-112854769.html
Makes sense. Notice that, at least in this report, there’s no suggestion of manipulation. It’s just that the number is in the wrong direction, the largest drop since December 2022. Prior to seasonal adjustment, a 373,000 gain was reported. The press is full of stories of kids having a tough time finding summer work. much of which tends to be leisure and hospitality jobs, but I can’t find evidence of that in the data.