As expectations of SoH reopening decline.
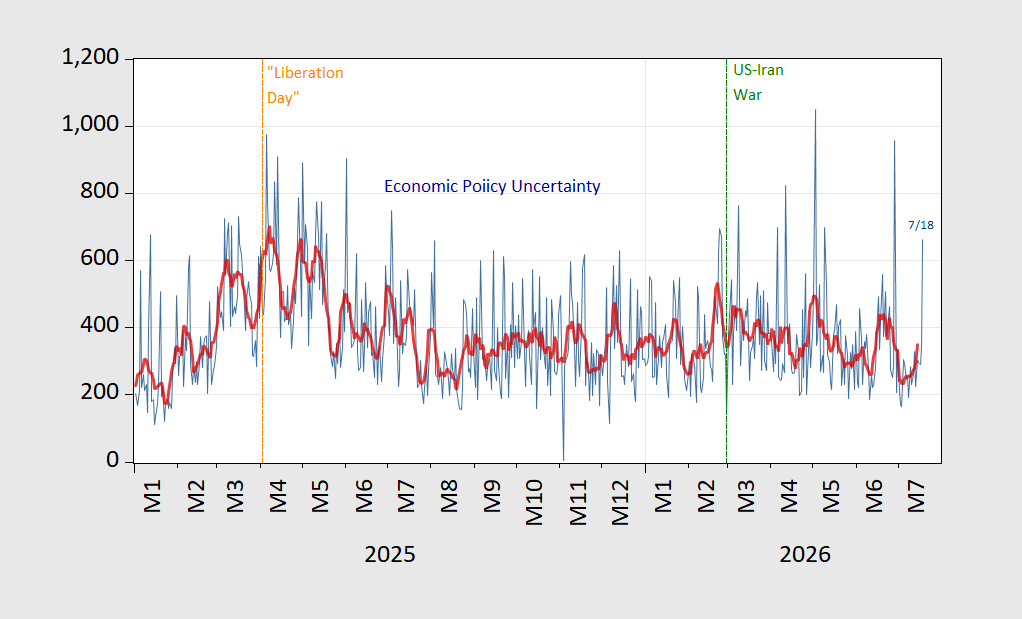
Figure 1: EPU (blue), 7 day centered moving average (red). Source: policyuncertainty.com and author’s calculations.
As expectations of SoH reopening decline.
Figure 1: EPU (blue), 7 day centered moving average (red). Source: policyuncertainty.com and author’s calculations.
The distinction between policy uncertainty and physical disruption seems important here. EPU can jump immediately when headlines and policy language diverge, while the oil-market effect should show up in physical measures such as outbound laden-tanker counts, terminal loadings, queueing times, and war-risk insurance. Plotting the EPU series against one of those would help show whether the latest move reflects headline uncertainty or actual constraints on flows.
One measurement question: is the last red point in Figure 1 really based on a centered 7-day average? A centered window needs three future observations, so a real-time endpoint would normally be trailing, partial-window, or revised later. Clarifying the endpoint treatment would make the latest jump easier to interpret.
WhenBuyOperator: Yes, notice red line ends a 3 days before blue … hard to see but if you squint.