Q2 GDP growth revised up 0.7 ppts, path of personal income ex-transfers up due to revised deflator. Here are the key indicators followed by the NBER’s Business Cycle Dating Committee:
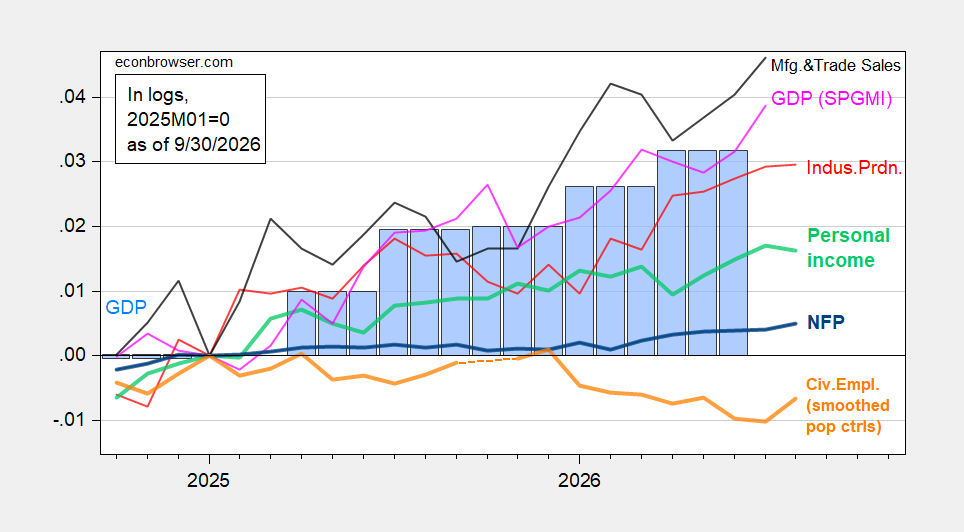
Figure 1: NFP employment (bold blue), civilian employment with smoothed population controls (bold orange), industrial production (red), personal income excluding current transfers in Ch.2017$ (bold light green), manufacturing and trade sales in Ch.2017$ (black), and monthly GDP in Ch.2017$ (pink), GDP (blue bars), all log normalized to 2025M01=0. Source: BLS via FRED, BLS, Federal Reserve, BEA 2026Q2 3rd release, S&P Global Market Insights (nee Macroeconomic Advisers, IHS Markit) (9/2/2026 release), and author’s calculations.
In the previous release of real personal income, January 2025 levels had not been reattained. As of today’s release, this measure was 1.6% above January 2025 levels.
The gap between output/income measures and employment indictors is hence thrown into yet sharper relief by the latest statistics.
Alternative indicators also buttress the argument for strong output growth.
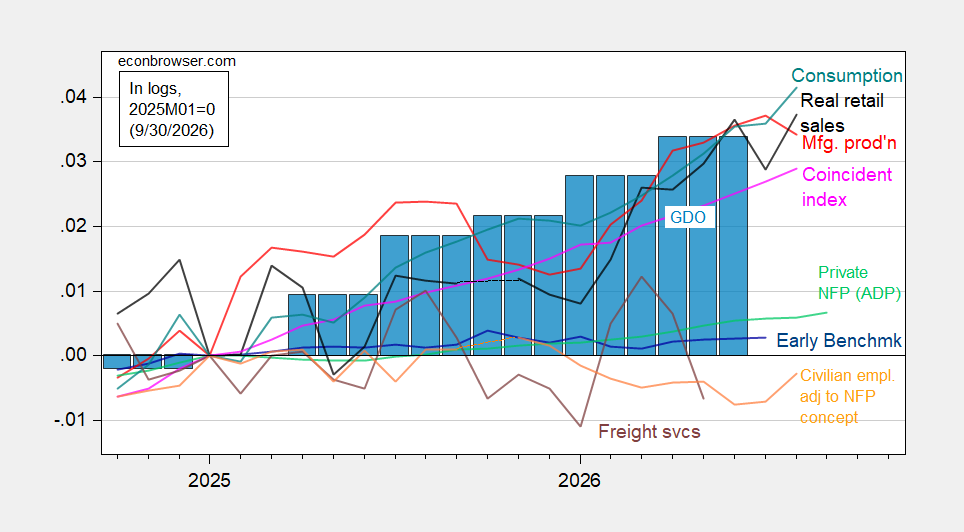
Figure 2: Civilian employment adjusted to NFP concept smoothed population controls, using experimental controls for 2025 (bold orange), manufacturing production (red), ADP private nonfarm payroll employment (light green), real retail sales, CPI deflated (black), freight services indexes (brown), and coincident index in Ch.2017$ (pink), GDO (blue bars), all log normalized to 2025M01=0. Source: BLS, ADP via FRED, Philadelphia Fed, Bureau of Transportation Statistics, Federal Reserve via FRED, BEA 2026Q2 3rd release, and author’s calculations.
The boom in consumption is notable. It grew at an annualized 6.6% in August. Although this is a preliminary figure, it reinforces the view that survey based assessments of the consumers’ mood — at deep lows right now — are not necessarily informative regarding actual consumption.
The drastic driver of the change in the trajectory of real personal income was not mainly the deflator, which added only 0.4% through July, but rather by a big increase in nominal income, which was revised higher by 1.6%.
I have not looked at the source data yet. Candidly I do not understand, if that data was available beforehand, why I never read a single word anywhere ahead of time that incomes were likely to be revised much higher. Even if there was no political interference, this is no way to run a first world economy.
Most of this is from higher inflation due to the middle east war. Looks like inflation from it and incomes added 1% to total trend. The other .6% is noise. The conference boards drop is a sign Christmas spending occurred early this yesr. Nice pullback gonna happen now.
BEA updated its calculation methodology for PCE components- portfolio management services, legal services, and computer software and the changes reduced the annual pace of core PCE inflation by roughly 0.2 to 0.3 percentage points.
yes, and that underpinned the upward revisions to GDP….the growth rate of the first quarter of 2026, which had been reported at 2.1%, was revised to a 2.5% growth rate with this revision, as the price index for gross domestic purchases for the first quarter of 2026 was revised from 3.6% to 3.2%….current dollar GDP growth for the first quarter was actually statistically unchanged at 5.76%…
that methodology change was a pretty good trick, lowering inflation and taking pressure off the Fed while boosting GDP at the same time, don’t you think?
Interesting 1999 parallel. The same thing happened. Next comes the final realization that the crude AI being manufactured won’t bring back anywhere near the income to make up for the debt. The bubble pops. Q1 2027?? With everything more concentrated it will even be more explosive than 2000.
I’ll add that the increase in income was almost entirely due to interest income, while wage/worker compensation was unchanged (actually dropped a bit). That’s not a great sign for the typical American who doesn’t have extra money to make major income in interest.
https://jakehasablog.blogspot.com/2026/09/income-spending-revisions-make-things.html
Savings rate are dropping fast, and given that wage growth keeps declining, it’ll likely get worse for September. Can’t think this is sustainable.