From the Washington Examiner, and op-ed, via AEI:
Author Archives: Menzie Chinn
NY Times Cover for 5/24/2020

Trump’s Implicit Valuation of Life: Back of Envelope Calculations from the Pandemic Response
According to researchers at Columbia University, implementation of shelter-in-place/social distance measures one week earlier would’ve saved 36,000 lives. Given the GDP that was generated in that one week, this implies Trump’s implicit valuation of one life is $1.16 million (compared to typical Value of Statistical Life of about $11 million).
How the (Soybean) Trade War Was Won
By the rest-of-the-world, i.e., countries that China did not retaliate against. Thanks, Trump!
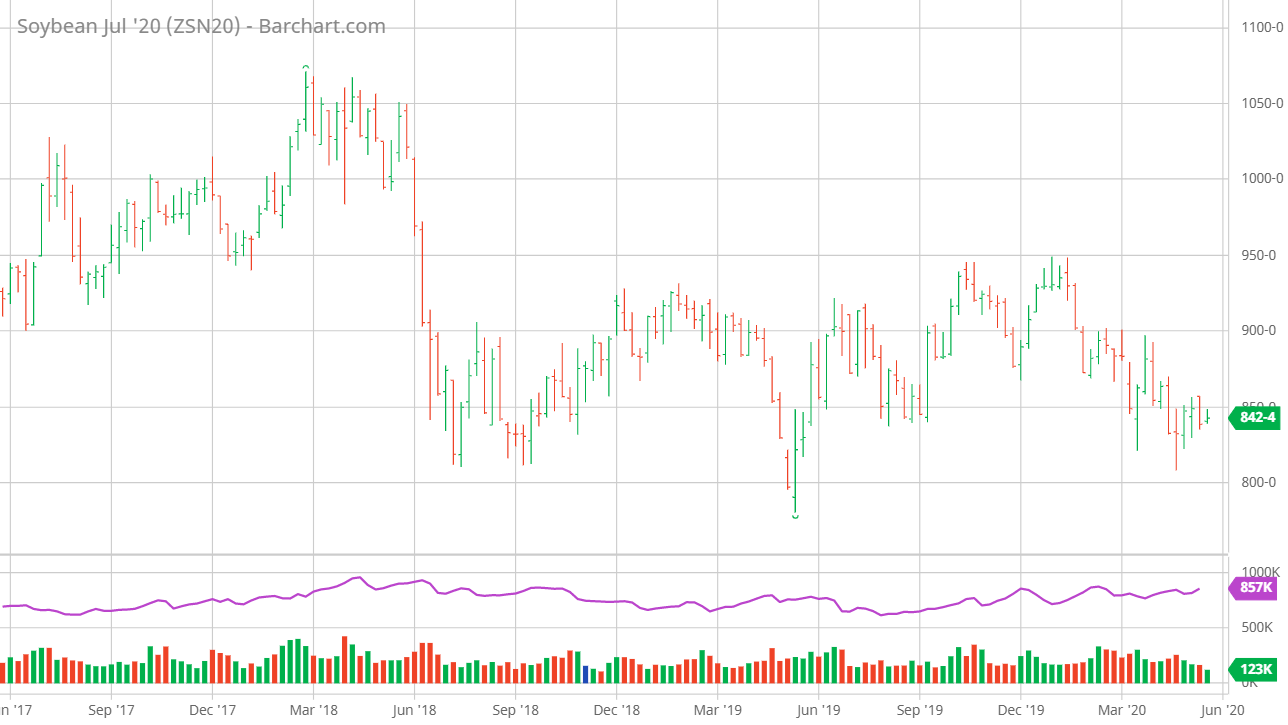
See also Carter and Steinbach (2020).
Our reduced-form regression results indicate large and statistically significant trade effects of retaliatory tariff increases for the United States and non-retaliatory countries. The identification is robust to pre-existing trends and anticipatory effects and reveals substantial heterogeneity between products and trading partners. We find that the United States lost more than USD 15.6 billion in trade with retaliatory countries. Soybeans, pork products, and coarse grains recorded the most substantial trade destruction effects. These losses are only partially compensated by additional exports to non-retaliatory countries. At the same time, non-retaliatory countries were able to considerably expand their trade with retaliatory countries. The analysis shows that these countries gained USD 13.5 billion in additional trade with retaliatory countries. The trade diversion effects are dominated
by increasing exports of soybeans and pork products. The primary beneficiaries of retaliatory tariff increases are countries from South America such as Argentina, Brazil, and Chile. Retaliatory countries also increased their imports from Eastern Europe and the EU. These results indicate that the 2018 trade war had substantial redistribution effects for global agricultural and food trade.
Tracking the State Economies during the Pandemic
A couple years ago, Ryan LeCloux and I were cataloging the ways in which to track the individual state economies, at higher than annual frequency (paper here). I think that topic will be of interest again. State employment figures for April will come out on the 22nd, Philadelphia Fed coincident indices on the 27th.
For now, consider the evolution of the coincident indices going from February to March.
Business Cycle Indicators, May 15th
With industrial production for April released, we have a clearer picture of economic activity in that month. Here are some indicators followed by the NBER’s BCDC.
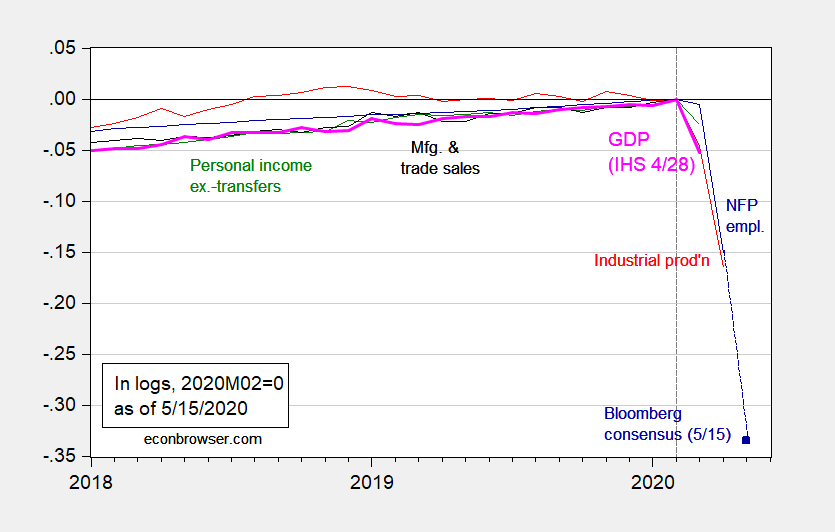
Figure 1: Nonfarm payroll employment (blue), industrial production (red), personal income excluding transfers in Ch.2012$ (green), manufacturing and trade sales in Ch.2012$ (black), and monthly GDP in Ch.2012$ (pink), all log normalized to 2019M02=0. Source: BLS, Federal Reserve, BEA, via FRED, Macroeconomic Advisers (4/28 release), and author’s calculations.
Guest Contribution: “Global bond market contagion in times of Covid-19”
Today, we’re pleased to present a guest contribution written by Laurent Ferrara (SKEMA Business School and International Institute of Forecasters) and Capucine Nobletz (University Paris Nanterre).
WSJ Survey: Less and Less “V”
From the Wall Street Journal’s May survey:
Continue reading
200 Economists: “Costly protectionism should not be foisted on patients at home and abroad”
From an open letter to Mr. Trump:
A Buy America directive can also hamstring the ability of U.S. pharmaceutical and medical equipment manufacturers to meet our future needs if firms are denied access to essential foreign supplies. Moreover, we can expect our trading partners to adopt retaliatory “Don’t Buy American” barriers targeting U.S. exports as this type of retaliation is already occurring between other countries.
Who Is Predicting a “V” Shaped Recovery?
I was wondering about this question as I followed the discussion of how to categorize recoveries. I was reminded by crampell to check the WSJ survey (which requires me to somehow circumnaviate the paywall), and this is what I found.