What does it mean for economic activity?
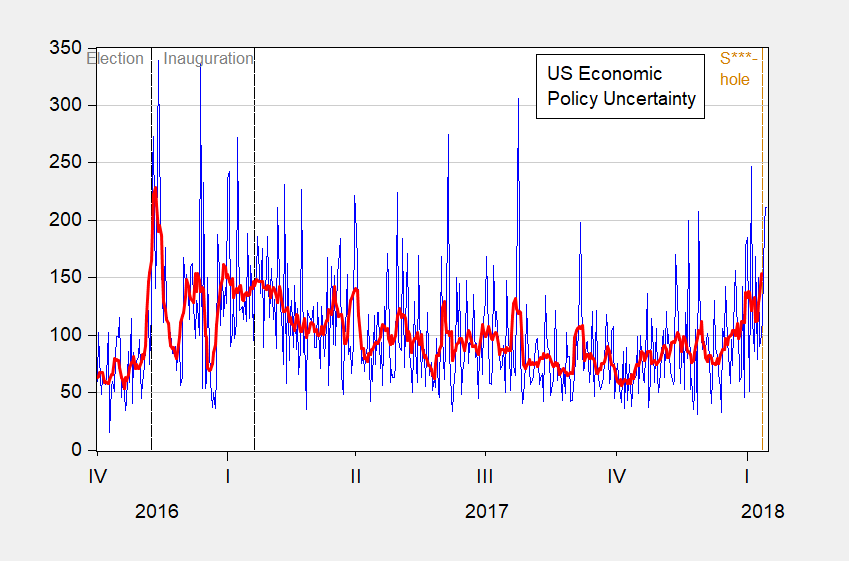
Figure 1: Daily US Economic Policy Uncertainty Index (blue), and centered 7 day moving average (bold red). Source: policyuncertainty.com accessed 1/15/2018, and author’s calculations.
Does economic policy uncertainty matter for real activity. In a new CEPII brief, Laurent Ferrara, Stéphane Lhuissier & Fabien Tripier review the evidence in “Uncertainty Fluctuations: Measures, Effects and Macroeconomic
Policy Challenges”.
Their Lesson #3 is particularly interesting.
The effectiveness of economic stabilization
policies depends on the state of uncertainty and should
then be adapted accordingly
Beside the role of public authorities in stabilizing political,
economic and financial uncertainty, the channel of
transmission of macroeconomic policies is likely to be
impaired by uncertainty. Under conditions of high uncertainty,
the effectiveness of fiscal and monetary policies is damaged,
and thus economic actors (households, firms, and investors)
become less inclined to respond to policy impulses. …
Entire brief here.
More on uncertainty, relating to Brexit, here, JIMF-BdF-UCL conference here, at ASSA here.