Update, 5:30pm Pacific:
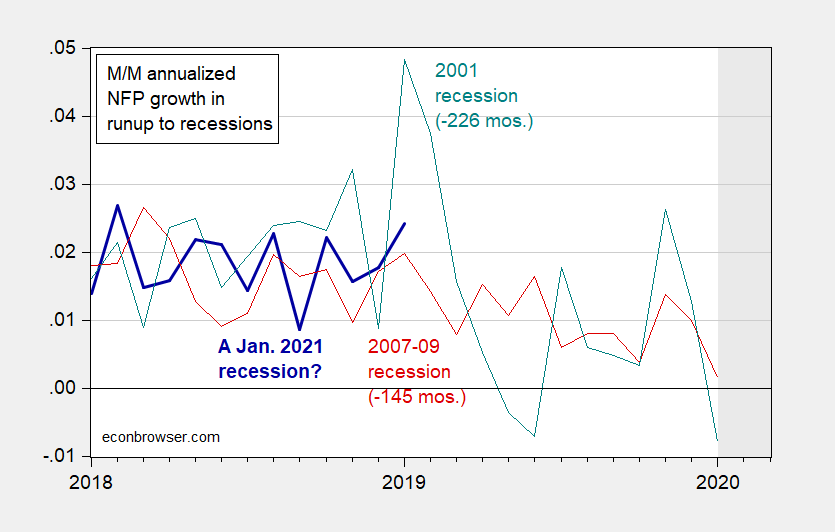
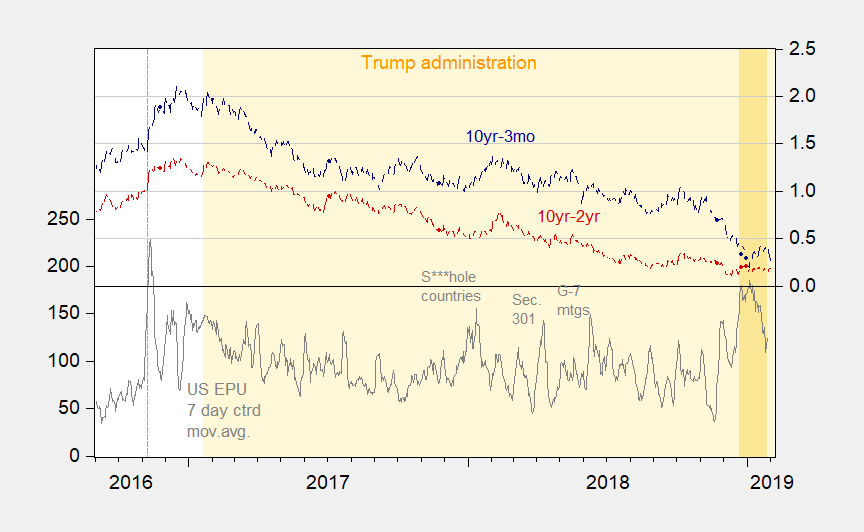
Forward looking indicators continue to suggest a slowdown.
Update, 5:30pm Pacific:
Forward looking indicators continue to suggest a slowdown.
December employment figures are out. Time to re-evaluate this assessment from a year ago in Political Calculations that California was in recession.
Continue readingGoing by these [household survey based labor market] measures, it would appear that recession has arrived in California, which is partially borne out by state level GDP data from the U.S. Bureau of Economic Analysis. [text as accessed on 12/27/2017]
November employment figures are out. Time to re-evaluate this assessment from a year ago in Political Calculations that California was in recession.
Going by these [household survey based labor market] measures, it would appear that recession has arrived in California, which is partially borne out by state level GDP data from the U.S. Bureau of Economic Analysis. [text as accessed on 12/27/2017]
That’s the topic of a new FEDS Note that I just published with Hie Joo Ahn. Here’s what we discuss:
The U.S. unemployment rate averaged 8.4% during the first five years of recovery from the Great Recession of 2007-2009, the weakest recovery on record. But as the expansion continued, unemployment continued to decline and by 2018 reached the lowest levels in almost half a century. Why did unemployment remain so high for so long, and what factors contributed to the recent lows?
That’s the title of an oped by Heather Boushey in The Hill. There’s not much to disagree with in the article, but I think one graph of Kansas employment would’ve really driven home the conclusion.
Bruce Hall takes issue with my post on Wisconsin’s employment growth, and writes (sarcastically):
Looks as if every state in the midwest is doing fine except Wisconsin.
Mebbe the unsarcastic interpretation is more correct. I let readers assess, based on these graphs.
August total NFP and private NFP also revised downward.
Continue reading
Maybe. But not as of 2018M01.
Continue reading