Category Archives: employment

Wisconsin February Employment Wrapup: Growth at Standstill, Private NFP Still 18,800 below Gov. Walker’s 250,000 New Jobs Promise

Wisconsin nonfarm payroll employment for January revised down, flatlines for February.


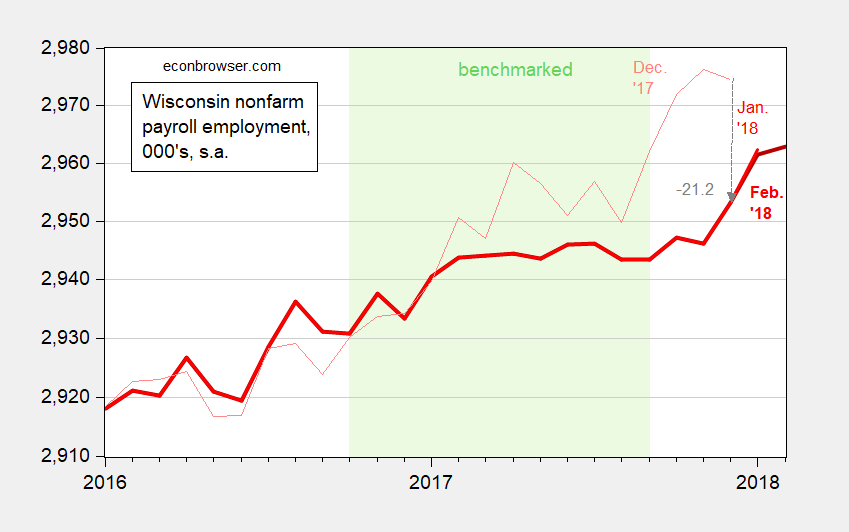
Figure 1: Wisconsin nonfarm payroll employment, February release (dark bold red), January release (red), December (pink), 000’s, s.a, on log scale. Light green shaded period denotes data benchmarked to QCEW data. Source: BLS.

Continue reading

California in Recession? (Part III)

Back in mid-December, Political Calculations asked if California was in recession. Data released by the Philadelphia Fed suggests the answer is no.


Figure 1: Coincident index for California (blue), and implied index value for June 2018 using leading index (light blue arrow, blue dot) against log scale. NBER defined national recession dates shaded gray. Red arrow at date of Political Calculations post. Source: Philadelphia Fed [1], [2], and author’s calculations.

Continue reading

If NFP Employment Growth Had Grown in 2017 (and January 2018) Like It Did in 2016

we’d have had over 340,000 more jobs in December. And over 380,000 more jobs in January


Figure 1: Nonfarm payroll employment (blue), and 2016 linear deterministic exponential trend set to match 2017M01 value (red), in 000’s, seasonally adjusted, on log scale. Orange shading denotes 2017 data. Source: BLS December 2017 January 2018 release, author’s calculations. (updated 2/2)

Continue reading

California in Recession? (Part II)

The release of labor market indicators suggests not, contra some recent commentary.


Figure 1: California civilian employment over age 16 from household survey (black), nonfarm payroll employment (dark blue), private nonfarm payroll employment (pink) from establishment survey, all in thousands, seasonally adjusted, on log scale. NBER defined recession dates shaded gray. Source: BLS and NBER.
Continue reading

Beware the State Level Household Employment Series: California Edition

Some analysts continue to infer short term trends solely based on household labor market series compiled at the state level. Here are two pictures showing why focusing on the household over establishment could be misguided.

Here are various vintages of the November release for California household/civilian employment series.


Figure 1: Civilian employment from household survey in California, from November 2013 release (blue), November 2014 release (red), November 2015 release (green), November 2016 (black), and November 2017 (teal), all seasonally adjusted. Source: BLS via ALFRED and FRED.

Continue reading