Expectations of central bank policies are only part of the story
The rapid decline in emerging market currency values has been quite remarkable:

Figure 1: Log exchange rates against USD for India (dark blue), South Africa (red), Turkey (green), Brazil (teal), Thailand (chartreuse), and Argentina (purple), all normalized to 2013M05=0. January data is for 1/22. Source: St. Louis Fed FRED, Pacific Exchange Services, and Financial Times.
The movements at first glance would seem to be attributable to revisions to expectations regarding future central bank policies — both quantitative/credit easing as well as the path of short rates (discussed in this post, as well as this June post). As Steven Englander (Citi) noted on Friday:
The sell-off in high-beta currencies, particularly in EM, is driven by an abrupt change of tone among G10 central banks with respect to liquidity provision. The fear is that the Fed, BoE, and even the BoJ will become less dovish more quickly than had been though even a few weeks ago. The question is whether one or more of these CBs will act to reverse this view, given that central banks talk all day about cooperation, but act only when disruptions abroad threaten national economies.
The Fed and the BoJ look most likely to signal that market fears of an abrupt pullback from abundant liquidity provision are overdone. Recent BoJ comments are stoking the fire, but there is unwelcome collateral damage to USDJPY and the Nikkei. The Fed is likely to be obsessed next week with domestic policy considerations rather than global repercussions. Most likely outcome is that we see more market friendly comments, but no indication of substantive change in policy.
But as Englander observes, G-3 central bank policies are not the only drivers; other global factors as well as domestic political factors are also weighing down on some currencies. This proposition is expanded upon in posts by Kaminsky at FT and Fernholz at Quartz.
The Other Factors
The global factor is China, or namely the Chinese slowdown [1] which presages (perhaps) lower commodity prices [2]. Domestic political factors are prominent in Argentina and Turkey.
Regarding the China effect, the IMF has some interesting work on the subject. Figure 4 (reproduced below from IMF (2013)) provides some summary results:
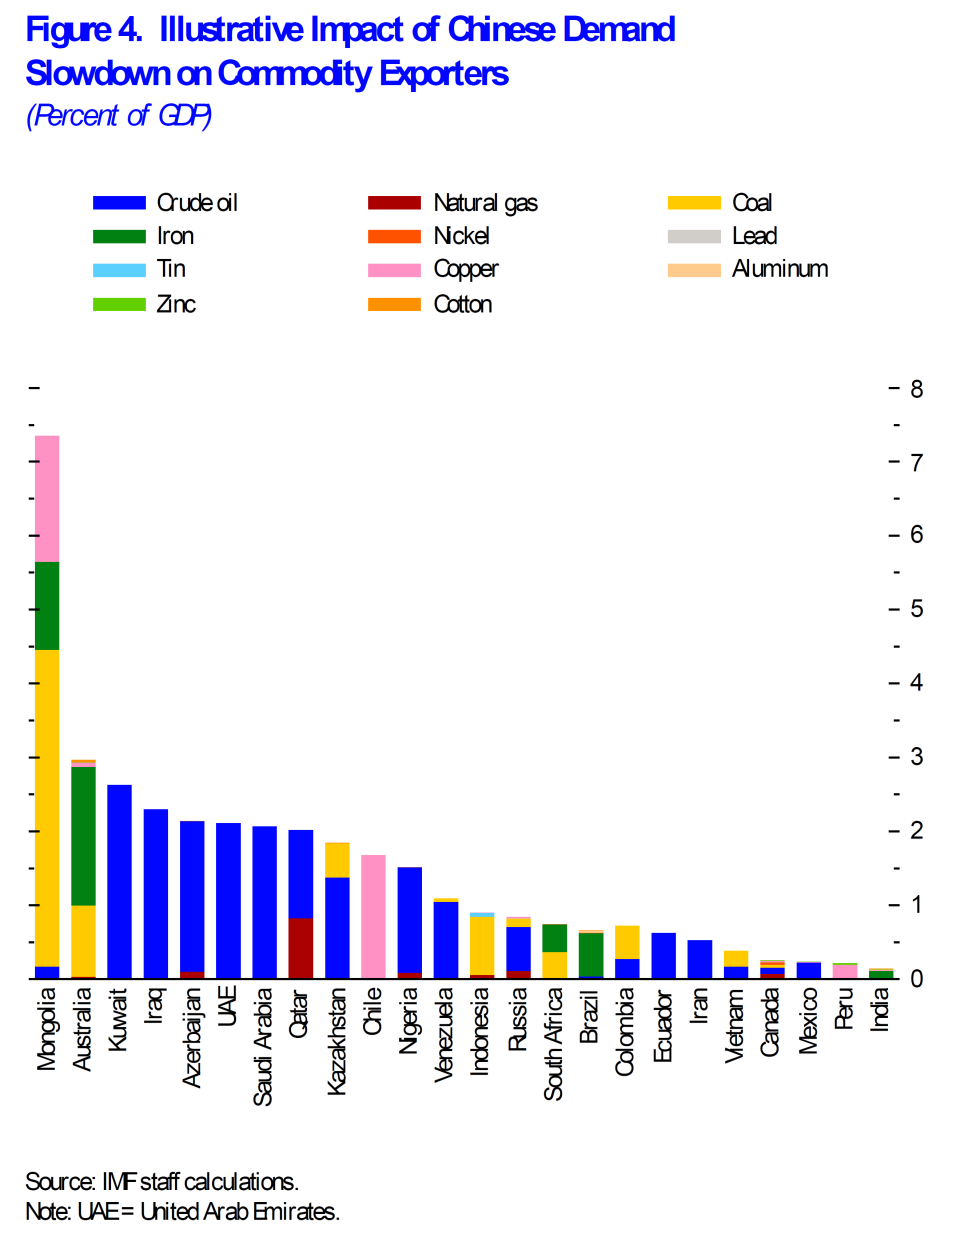
Figure 4 from IMF (2013).
The graph is described thus:
Figure 4 illustrates rough estimates of the impacts of a slowdown in Chinese growth from an average of 10 percent during the previous decade to an average of 7½ percent over the coming decade. The numbers shown in the figure are the declines in net revenues (as a percentage of GDP, adjusted for Purchasing Power Parity) for various commodity exporters as a result of lower Chinese demand.
Of these, Brazil and South Africa have experienced noticeable losses over the past month, as shown in Figure 1.
One remark about Argentina. The extreme drop in the Argentine currency is associated with the central bank’s decision to cease intervention.[3] This is a reminder that one cannot infer the extent of the shocks (arising from foreign monetary policy, economic uncertainty, terms of trade, and political uncertainty) from observed currency movements, as much depends on the central bank reaction function — which in turn depends in part on the size of foreign exchange reserves (Argentina’s are fast declining [4]). More on that in this post.
Update, 1/27, 11:45AM: See also Joe Joyce on recent events, as well as Economist (1), Economist(2), Economist.
First of all, I like the look at feel of the new and improved Econbrowser. Very nice. Font is nice, font color is nice. So, very good. I’m not sure I’m completely sold on the light blue border. Does it have enough contrast? Well, it’s traditional in any event. A very handsome upgrade overall.
I like the little math tests before being allowed to submit a comment. Will they get harder over time? Example with logs, maybe a few differentials? I guess we’re getting a better sense of who the target audience is, eh, Menzie?
As for China’s growth: The oil stats say China’s growth has been decelerating for a year, and current GDP growth is in the 0-3% range. Is there another historical example of a major GDP driver like China growing at 7.5% and the currencies of its major vendors collapsing? Do we really believe China’s 7.5% reported GDP growth? In volume terms, that would be as much as 10% GDP growth in 2005. And in 2005 there were all sorts of stories in the press about China’s booming energy sector, housing, manufacturing, luxury goods, exports, infrastructure, etc. Most of what I read about China lately is air pollution, ghost cities and South China Sea tensions. We sure this economy is growing at 7.5%?
Steve Kopits: 2013Q4 q/q non-annualized growth was 1.8%; that’s 7.4% at an annualized rate. Where do you get the 0-3% rate?
The IMF’s January WEO forecasts 7.6% q4/q4 growth for 2014.
A thought on the IMF.
The IMF, as I recall, completely blew the size of Greece’s deficit, although a good number of people thought the numbers were cooked.
Now, if the Chinese government says GDP growth is 7.4%, does the IMF have the data or the fortitude to publish a materially different number?
How long did it take for the IMF to crack down on Argentina’s inflation number? Does the institution have the spine to suggest that China is taking excessive liberties? This is one of the problems I have in interpreting the data. I don’t know how much effort the various international orgs like the IMF and the I-banks really invest in second guessing official data. So I don’t really know if I am seeing an independent view or merely the re-cycled official view when I see Chinese GDP data.
From Platts: Chinese oil demand in December: once again, it’s down year-on-year
China’s apparent* oil demand in December 2013 fell 1.9% to an average 10.11 million barrels per day (b/d) or 42.76 million metric tons (mt) versus prior year data, according to a Platts analysis of China’s latest government data.
December was the second consecutive month that China’s apparent oil demand contracted and marked the third monthly decline this year, behind November’s 2.1% decline and September’s 2.3% drop.
This simply does not happen when an economy is not in recession. You will not find an example of this anywhere in the historical record, to the best of my knowledge.
http://www.platts.com/pressreleases/2014/012714/no
German oil consumption is falling consistently, while their GDP grows.
Perhaps you’re thinking of the previous period from 1930-2004, when oil was in surplus, and oil prices were dirt cheap?
German GDP growth, per IMF:
2012: 0.9%
2013: 0.5%
2014: 1.4%
2015: 1.4%
2016: 1.3%
2017: 1.3%
2018: 1.2%
I have contended that a constrained oil supply is knocking 0.7-1.2 percentage points off of GDP growth. I don’t see anything in the German GDP figures to make me change my mind.
I agree that higher oil prices will affect economic growth to some extent – I think that’s commonly agreed among mainstream economists.
But, I thought you were saying above that a drop in oil consumption of about 2% year over year “simply does not happen when an economy is not in recession.” We agree that’s not the case, right?
7.4% is strong growth. That should be reflected in the other indicators that we see, including:
– positive press reports about all the impacts of growth
– strong vendor sales (ie, Brazil, Australia, Middle East)
– rapidly increasing oil consumption (GDP growth + 1-2%)
– strong sales from equipment providers like Caterpillar
None of that is true. Instead, my Chinese analyst tells me her contemporaries are having a hard time finding jobs. You can read that China’s elite are fleeing the country. We can see persistent instability in the financial system. The Shanghai composite index has been falling for years. You have to go back to 2006 to see it at current levels; and indeed, the index first reached its current level in 2001–more than 12 years ago.
If you gave me all these anecdotes and asked me what I thought GDP growth was, without prior knowledge of the number, I would say, well, pretty low, maybe even a recession. But under no circumstances would I offer that GDP growth had been averaging 7-8% for the last four years.
On the other hand, electricity consumption was reported up 7.5% yoy in November, which would be consistent with GDP numbers (and of course, the Chinese authorities know that).
So, I don’t know. But the picture is not coherent from my perspective.
Are these consistent with 7.4% GDP growth?
I have two comments:
1) Yes indeed the fall in emerging market currencies has been quite dramatic; the driving factor has been the rise in the Benchmark Interest Rate ^TNX.
Under the rule of the libertarian despised Creature from Jekyll Island, mankind experienced the Means of Economic Inflationism, that is the Benchmark Interest Rate, ^TNX, driving inflation in both fiat money, defined as Aggregate Credit, AGG, coupled with Major World Currencies, DBV, and Emerging Market Currencies, CEW, as well as fiat wealth, defined as World Stocks, VT, Nation Investment, EFA, and Global Financials, IXG, ever higher.
But when the bond vigilantes gained control of the US Ten Year Note, ^TNX, calling it higher from 2.48, on October 23, 2013, fiat money died in a deflationary extinction event. Then fiat wealth died the week of January 24, 2014, as investors derisked out of debt trade investments and deleveraged out of currency carry trade investments, forcing World Stocks, VT, Nation Investment, EFA, and Global Financials, IXG, lower in another deflationary extinction event.
The Benchmark Interest Rate, ^TNX, was the Means of Economic Inflationism, but after the pivotal event of October 23, 2013, it is now the Means of Economic Destructionism, establishing economic deflation and economic recession, terminating economic inflation and economic growth.
2) Please consider that the dramatic fall in the emerging market currencies was of epic consequence; please consider that the week ending January 24, 2013, World Stocks, VT, and the US Dollar, USD, UUP, as well as Major World Currencies, DBV, and CEW, traded lower on the failure of trust, terminating liberalism and introducing authoritarianism, both as a paradigm and an age of regional governance and totalitarian collectivism.
According to the Apostle Paul in Ephesians 1:10, Jesus Christ is the Operative Genius of the economy of all things, and through His dispensation, that is His administrative oversight for the completion of all things economic and political in every age. In the era of liberalism, He provided social mobility to the wily investor, to those successfully engaged in clientelism, and to a broad number of those lived as beneficiaries of debt trade investing and currency carry trade investing, under the Milton Friedman Free To Choose floating currency system which began in 1971 when President Nixon took the US off the gold standard to finance the Vietnam War.
The subprime crisis led to the financial system crash of 2008; and it is likened to a fatal automobile crash that killed all the occupants. Regeneration of economic life came through Paulson’s Gift, that being Ben Bernanke’s QE1 and TARP, which traded out “money good” US Treasuries for Distressed Investments, such as those traded in Fidelity Mutual Fund FAGIX.
Jesus Christ provided liberalism as an economic domain, that is a place for economic experience, where He rules in dispensation. It was trust in Ben Bernanke and his monetary policies, that began liberalism’s terminal phase as both a paradigm and age, where the investor and clients living in clientelism were the centerpiece of economic life, whose experience was shaped by floating currencies in a Zero Interest Rate regime.
Economic life was through fiat money, defined as Aggregate Credit, AGG, and Major World Currencies, DBV, and Emerging Market Economies, CEW; but it died on October 23, 2013, when Jesus Christ opened the First Seal of the Scroll of End Time Events, and released the Rider on the White Horse, to effect a global economic and political d’etat, which terminated the Creature from Jekyll Island, and birthed the Beast of Revelation 13:1-4, which is rising to rule the world in the new economic domain of authoritarianism.
Fiat wealth, defined as the output of economic life under liberalism, consisting of World Stocks, VT, Nation Investment, EFA, and Global Financials, IXG, died on January 24, 2013, with the failure of investor’s trust in the monetary policies of the world central banks monetary authority, and the collapse of freedom of choice provided by democratic nation state governance as is seen in numerous places such as the Ukraine.
Steven Kopits wrote:
“Is there another historical example of a major GDP driver like China growing at 7.5% and the currencies of its major vendors collapsing?”
Steven,
Sometimes your understated questions make me laugh out loud! I was going to ask this same question, but I doubt I would have been as witty in a Shakespear sense as you were.
New Zealand has already proven the power of a rules based monetary policy rather than a seat-of- the-pants monetary policy such as that of the US. India is moving in the same direction and is another experiment to prove the power of a monetary policy that makes a currency a consistent tool for traders.
The Hindu: “Towards a rules-based policy”
“What Keynes posited was the equivalent of saying that manipulating scales is the way to attack obesity.”
Steve Forbes
I actually wasn’t trying to be witty, Ricardo. The difference in interpretation makes a huge difference for oil prices. As you know, we use supply-constrained forecasting, which states that there’s not enough oil to go around, and this tends to support the oil price near the carrying capacity level. Now, the US has added a significant amount of oil consumption in the last quarter, so I don’t anticipate too much incremental US demand for the next year going forward. Meanwhile, China’s demand growth has ground to a halt. Thus, my price forecasts hinge entirely on a European revival, which is possible, but something of a thin reed. All this suggests downward pressure on Brent, which would validate, for example, the views of Credit Suisse or Citi.
On the other hand, if China is intact, then its demand will come back quickly, and we could see upward pressure on Brent. So it comes down to China, and I just don’t feel confident in the data I am seeing. I’m not sure which way to call it for the moment.
Is there any way to make the graphs larger in the post? I like how they get really big when you click on them, but sometimes it is nice to compare what you are reading to the graph while you are doing the reading, instead of jumping back and forth.
Also, I think it may be easier on the eyes to make the teal border much darker. Microsoft does this with their Office products: there is a setting in which you can change the Ribbon from the Default Blue to a Dark Grey, and analysts almost always make this change, and often times analysts that stare at spreadsheets a lot actually change their entire spreadsheet to a dark grey. This is because it is very strenous on the eyes to stare at a white/light colored screen for an extended period of time, but much easier if the screen colors are a little darker.
Overall I love the new site!
Anonymous: Always appreciate suggestions like this. Do you like the new color better?
Much better! Graphs are better too….
Thanks!
Like this color better.
S.
I expressed some similar thoughts in a post on this subject:
https://blogs.wellesley.edu/jjoyce/2014/01/27/shake-rattle-and-roll/
kopits, in your china models are you accounting for the increase in renewables which are occurring throughout china? when visiting Beijing last year I found restrictions on automobiles-only certain cars were allowed to be on the road in a particular day. how much are these items slowing down oil consumption? they may help explain why oil consumption is slowing but the economy (gdp) is agreeing with say electric consumption, and increasing.
Baffs –
I have not looked into the matter in close detail. Jan Stuart of Credit Suisse opines that there’s a missing diesel quantity. But the issue is that China’s oil demand growth has experienced secular decline month-on-month for the last year. It’s not so much that it’s at a low level as that it’s been decelerating quite fast, faster than we’d expect from legislative action.
Also, the Chinese purchased 21 m autos last year, versus 15.6 m in the US, and yet US oil consumption in barrels terms was growing twice as fast as that in China. That doesn’t make sense, on the face of it. China’s oil demand should be growing faster than the US’s, indeed, much faster.
kopits,
one issue is the traffic congestion in the major Chinese cities. people may be buying cars-but its hard to put miles on them because of daily restrictions on who can drive-and the traffic jams which minimize their usefulness. their mass transit systems more than make up for the gridlock on the highways!
Baffs –
That might explain somewhat slower growth, but under no circumstances account for an actual decline in Chinese oil consumption, which is what we have seen in the last several months.
Put another way, we would expect to see both an rapid increase in the fleet (21 m cars sold) and an increase in miles traveled per car as people become more prosperous. We’re not seeing that.
The simple interpretation is that China is in recession.
I think one wildcard is diesel consumption for on-site electrical generation in manufacturing. As the grid grows, one might see a sharp decline in diesel consumption. That’s consistent with robust grid kWh growth.
kopits,
I still think you underestimate the issue of traffic congestion and alternative energy sources. just because more cars are purchased does not mean more driving is occurring. consider it a status symbol for purchase-but everyday movement in cities such as Beijing are much easier via subway. and the increases in solar and wind power stations should result in decreases in oil consumption if they serve as replacements. I guess my point is that the world is changing in china and the metrics used to assess “growth” even five years ago may begin to become obsolete. perhaps you are a bit too oil centric in your assessment of china’s economic future.
Darker print, please, Professor Chinn and Hamilton. Word Depress, look for technical issues in the future.
The World Governments have upload the greatest amount of debt since the creation
of the governmental unit. Debt has become an instrument of governance.
The new site is an improvement over the last. Thank you most kindly!
The bosses pictures should be somewhere on the main page.
@Steven Kopits (et al.)
The last two years it was SOP of Schäuble to announce every three months that the actual tax revenues were (much) higher than the calculated ones on all levels (local, state, federal).
For me as – admittedly sometimes economically naive- scientist that meant that very likely the official GDP numbers, that were used to estimate taxes revenues, were actually not correct.
Interestingly, since last week this problem makes headlines in many Germany newspapers: Some economists estimate that the GDP actually has grown between 2-3% instead of the officially reported 0.5-1%.
Therefore, from a purly scienticic POV there is a good chance that the real corrected data for Germany that we may see in two years do NOTsupport your model.
(I do not claim that the higher numbers are a really good message, but this is an other topic).
For me as somebody whose family is directly affected by German economic development the more interesting question is:
With Germany having a stagnating population, no increase in public debt/GDP ratio due to balanced budgets on all levels, an industry which improves energy intensity by ~1.5 per year, rest of the economy by 1%, what is the problem of an annaul GDP growth of “only” 1%?
I would ask: what goals are unfinished? Are all children and elders properly cared for? Is all pollution cleaned up, GHGs eliminated? Has cancer and Alzheimer’s been cured (what % of German GDP goes to medical research – why not 5x as much?).
Until then, we need to do more, not stagnate.
I don’t see any good fundamental reason for many of these moves among EM curriencies. For example polish currency lost value and it has nothing to do with Chinease demand and central bank policies. It is only speculation.