The BEA has released a new quarterly Gross State Product (GSP) series for states — a tremendous innovation for those of us interested in tracking state economies.
One interesting comparison is Minnesota vs. Wisconsin. With GSP data, one can look at the ratio of per capita income expressed in Chained 2009$ (rather than the ratio of indices, as I have been doing using the Philadephia Fed data, e.g., [1]).
Here is the log ratio:
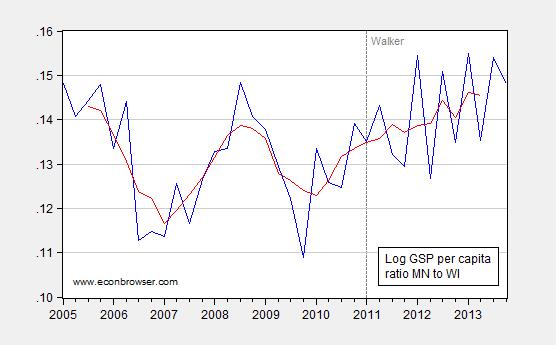
Figure 1: Log ratio of GSP per capita of Minnesota to Wisconsin (blue) and five quarter centered moving average (red). GSP in Ch.2009$, SAAR; population is annual resident population, interpolated using quadratic match average. Source: BEA, FRED, and author’s calculations.
Notice that Minnesota starts moving up and away from Wisconsin around 2011. That’s eyeballing. Using a structural break test (n-step ahead recursive residuals test) confirms that conjecture.
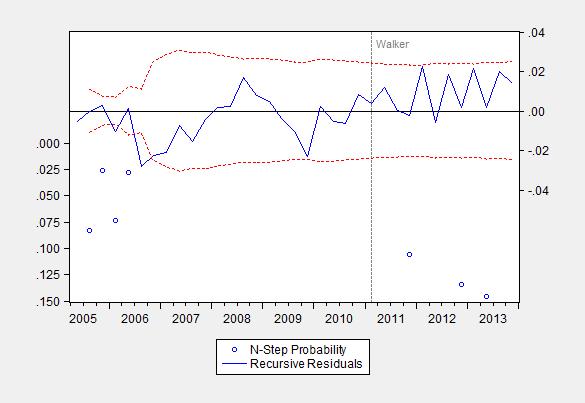
Figure 2: n-step ahead recursive residuals test for constant percent difference in MN and WI per capita income.
There is a break with borderline significance indicated at 2011Q4.The recursive residuals indicate that Minnesota per capita income has been statistically significantly higher than Wisconsin since end 2011 (equivalently, Wisconsin’s per capita income lower than Minnesota’s).
Update, 8:45AM Pacific, 8/23: Louis Johnston also delves into the new quarterly data series, focusing in with much greater detail on Minnesota.
This series was made possible partly due to BEA releasing quarterly GDP by industry for the first time earlier this year, a major innovation for those interested in tracking industry quarterly contributions to real GDP growth.
Keep in mind, though, as BEA notes, that while nominal GDP by state captures the differences across states due to relative differences in the mix of goods and services that the states produce, real GDP by state does not capture geographic differences in the prices of goods and services that are produced and sold locally.
BTW, ratios calculated using chained dollars in the numerator will yield the same result as ratios based on indices, since the chained dollars are simply reference year (2009) current dollars extrapolated with the corresponding quantity index. It is nice, though, to be able to express productivity differences in dollar terms.
Ben Around,
check your data.
The BEA also started publishing state CPI estimates so you can compare the cost of living between state.
This state real GDP data also incorporates the new cost of living comparisons so the real GDP does include the adjustment you say it does not.
If you look at the data it shows that the bulk of the differences in cost of living by state stem from the cost of housing. The differences in the cost of other goods and services by state is relatively insignificant. A new car cost about the same in Connecticut as in Nebraska.
Spencer,
check your documentation.
last paragraph of documentation linked to the original post:
“Real GDP by state captures the differences across states that reflect the relative differences in the mix of goods and services that the states produce. However, real GDP by state does not capture geographic differences in the prices of goods and services that are produced and sold locally.”
BEA’s new regional price parity measures are used only to deflate personal income, not production. I’m a bit surprised that they did not incorporate these new price measures, but perhaps they will later. The State-level production deflators are simply weighted averages of national industry value added deflators, with the weights based on the State’s share of the industry’s nominal value added.
All considerations based on GDP, whether national or state level (which I think is is usually called GVA), for “advanced” economies are fundamentally flawed for a major reason:
* GDP/GVA is supposed to measure gross (of depreciation) value added (that is net of inputs).
* GDP over the past several decades has gone from 80% agriculture and manufacturing to 80% services and government.
* There is no good way to compute gross value added for most services and government, there are big theoretical problems and huge practical ones.
National statistical agencies don’t know how to define or measure value added in services and government either at the country or local level, and therefore career-oriented national statisticians either simply make it up (many!) or use rigged estimates (rigged in the sense that they always make it look bigger).
For example in many cases gross value added of a service industry is “estimated” as the sales or the income derived from that industry, with ovbious comical consequences. Except that the consequences chosen by statistical agencies are nearly always those by which GDP is reported higher.
Note: gross value added is obtained by subtracting the value of inputs to avoid double counting; e.g. tires sold to car manufacturers for newly built cars.
As to *real* GDP or GVA, the deflator used for “estimating” it suffers from the same vast number of rather clever adjustments that career oriented national statisticians use; nearly always they make the deflator smaller than it would otherwise be (by finding clever ruses to say “but that is not inflation”) and thus boost “real” GDP higher than it would otherwise be.
Nominal and “real” GDP in advanced economies where 80% of it is accounted by services and government is a fantasy number for playing fantasy economics, or equivalently is a propaganda talking point.
For example, a large proportion of USA States (or UK regions) with quite a lot of population and output saw a rather large collapse in economic activity over the past 30 years, yet amazingly except for a few recessions here and there, the nominal or real USA GDP (and UK GDP) continued to march upwards (but not so median hourly wages…), perhaps thanks in large part to the clever technologies of national statistical agencies.
GDP indices are market-moving, vote-moving numbers, and like all such numbers, the urge to get them “LIBOR”ed is irresistible.
PS: the above only as to problems with how GDP is measured. Then there is the problem that since depreciation is not subtracted from GDP then asset struipping in effect results in a larger reported GDP…
As to asset stripping being a GDP-booster according to current rules, IITC at the national level in both the USA and the UK home equity extraction (HELOCs aka remortgages) have been larger than GDP growth over the past 20-30 years.
Note: home equity extraction via HELOCs/remortgages does not as such add to GDP, but the capital gain thus monetized is spent and that adds to GDP.
That asset stripping has been a huge GDP booster may be also reflected in (private) debt growing much faster then GDP over the past 20-30 years too, with the (private) debt-to-GDP ratio climbing to several times GDP in both USA and UK. If the GDP of USA and UK was doing as well as reported, why is debt growing so much faster?
It would be fascinating to compare home equity extraction and GVA by state; since real estate speculation is not uniformly distributed across the various USA States or UK regions I suspect that in some of them home equity extraction is not only larger than GVA growth, but has been a large fraction of GVA itself.
Another interesting point on which to compare national GDP and Ste or region GVA is to look at the “reported profits” of financial conmpanies, which have been a pretty large and growing part of national GDP in both USA and UK. The crisis in 2008 showed that most of those profits were accounting illusions, where revenues had been front-loaded and risks had been pushed back in time; but thanks to Congress changing the accounting rules, suspending “mark to market” those profits have never been restated, or the resulting losses never been materialized (just stored away in some obscure companies owned and financed by the Fed Board).
Again it would be really amusing I suspect to look at how much financial sector “reported profits” have “contributed” to GVA and GVA growth by USA State or UK region, as the financial services “industry” is not uniformly distributed across them.
Note: it is also hard to see for me whether real estate and financial services have *any* value added, or whether it is negative, and to see any justification therefore for *adding* their cleverly “estimated” (gross) value addeds to national GDP or local GVA; or at least whether in large part their outputs should be considered inputs of other industries and thus their turnover be subtracted, to avoid double counting, from that of those industries, if only on an “estimated” basis :-).
«look at the “reported profits” of financial conmpanies, which have been a pretty large and growing part of national GDP in both USA and UK. The crisis in 2008 showed that most of those profits were accounting illusions, where revenues had been front-loaded and risks had been pushed back in time;»
As to this given the large and increasing part that corporate profits, and in particular financial corporation profits, have in GDP and in its growth, governments have now a large incentive to condone or promote massive accounting fraud, especially in financial corporations, as that boosts reported GDP; and an equally large incentive in condoning or promoting the avoidance of recognizing losses in corporate accounts, because those losses would lower GDP.
In other words corporate reported profits, and their impact on GDP, are both market-moving and vote-moving, and there is thus a huge incentive to LIBOR’ize them, with regulators looking the other way.
Probably one of the two reasons why the USA and UK goverments have been determined to avoid prosecuting corporate fraudsters as that would have triggered the recognition of the losses due to frauds and thus lower GDP, as “BC” pointed out in a different language here:
https://econbrowser.com/archives/2014/08/what-did-quantitative-easing-accomplish#comment-184460
«but thanks to Congress changing the accounting rules, suspending “mark to market”»
Mission accomplished! 🙂
@Spencer “The BEA also started publishing state CPI estimates so you can compare the cost of living between state.”
Siince when is the BEA in the CPI business? I do not see CPI calculations on the BEA website.
In addition to Wisconsin having less efficient energy regulations, it also has a disadvantageous tax climate for those over a certain income;
http://www.maciverinstitute.com/research/2014/08/report-is-the-tax-code-driving-taxpayers-from-wisconsin/
‘The State Tax Calculator shows us that a single 25-year-old earning $30,000 is better off in Wisconsin than Iowa, Illinois and Minnesota. But, as this taxpayer earns more and purchases a home, it is actually advantageous to move to Iowa or Minnesota.
‘Essentially, the state is penalizing taxpayers for being more successful.
‘With Wisconsin discouraging home ownership and higher income, it is no wonder that $136 million leaves the state every year. ‘
Then there’s the dysfunctional political climate, with state legislators running out of Wisconsin to hide from the governor. Also the neo-Marxist public employee unions fighting tooth and nail to retain their privileges. It might be a miracle that Wisconsin does as well as it does.
Patrick R. Sullivan: Could this be a quote from the same MacIver Institute that disingenuously mixed and matched different data series to put a positive gloss on job creation numbers in Wisconsin? Why, yes it is! No matter — I expected nothing more from you. Argument by anecdote is the level you’ve descended to. (By the way, the Wisconsin economy is over $280 billion — and MacIver/National Center for Policy Analysis is pointing to $136 mn/yr as a massive crisis?)
One interesting aspect of the MacIver Institute/NCPA “analysis”: There is no regression analysis, just a correlation involving 9 states…
Perhaps a review of the literature, like that conducted by CBPP, would’ve been better — but only for people who actually want to know something, rather than those already in the possession of revealed wisdom.
Patrick R. Sullivan This strange. Both Iowa and Minnesota have higher top marginal income tax rates, so it’s not clear how they came to the conclusion that taxes went up with income faster in Wisconsin. My guess is that they data mined and twisted numbers in order to find some special case where taxes might be higher in Wisconsin. And then they twist more facts and tell voters in Iowa and Minnesota that their higher taxes are driving people to Wisconsin. That is the kind of dishonest state-by-state comparisons I often see from right wing groups like the Heartland Institute.
When you go to the MacGoober article you’ll find on page five a dire comparison of Wisconsin and Florida showing how young Wisconsinites are being driven (driven I tell ya!) to Florida because of the tax differential. Well is that in fact true? Apparently not according to the data set published by the New York http://www.nytimes.com/2014/08/20/upshot/where-we-went-state-by-state.html?abt=0002&abg=1
There you learn that LESS THAN 1% of Floridians name Wisconsin as their birth state. Additionally when you further divide those numbers by the number of 20-29 year-old Wisconsin natives in Florida, you find that you end up with a population of 8,000 (which includes a good number of college students). Not 8,000 a year–but 8,000 total or about 400 a year (so we need to over heal our tax policy because of 400 people?). And this loss is partly offset by the less than 1% of Wisconsin’s population that was originally born in Florida, who are, apparently, unbothered by the bad tax environment they are moving into. OR, or, perhaps interstate migration is not a function of state tax policy (which is, of course, the correct answer).
MacGoober Institute analysis is always flawed as it is overtly constructed to promote an ideological system. So it’s pretty easy to pick it apart. I did so in about 10 minutes.
In fact a CBPP analysis shows that Wisconsin ranks 5th (between Florida and South Carolina) in holding onto its population. http://www.offthechartsblog.org
Debt/Capita?
How does Wisconsin’s long term debt burden impact long term GDP compared to Minnesota’s?
The Interest on increasing debt is the burden put on our children.
“After fiscal year 2013, the state’s real deficit, based on Generally Accepted Accounting Principles, is $1.7 billion. That’s down from the $2.9 billion when Gov. Scott Walker took office and is the lowest since 2003. The better-than-expected state revenue, some $760 million that materialized at the end of the past fiscal year, has played a big part in lowering that debt load.”
Anybody want to look at Wisconsin’s debt? … Bueller? … Bueller? January 2014
Minnesota debt $9,750/citizen
http://www.usdebtclock.org/state-debt-clocks/state-of-minnesota-debt-clock.html
Wisconsin debt $8,600/citizen
http://www.usdebtclock.org/state-debt-clocks/state-of-wisconsin-debt-clock.html
Deficit going down you say? Don’t write about what you don’t know. The structural deficit is starting to look ominous.
http://jakehasablog.blogspot.com/2014/08/not-saying-wisconsin-budget-is-blown-but.html
David L. Hagen: I don’t suppose you happened to look at the debt-to-GDP figures for those two states. Didja notice that Wisconsin had a higher debt-to-GDP ratio than Minnesota? Sigh. (Who looks at debt/capita anyway? Can you calculate a sustainability equation using that ratio?)