The Chinn-Ito index revised and updated to 2012 is now available here.
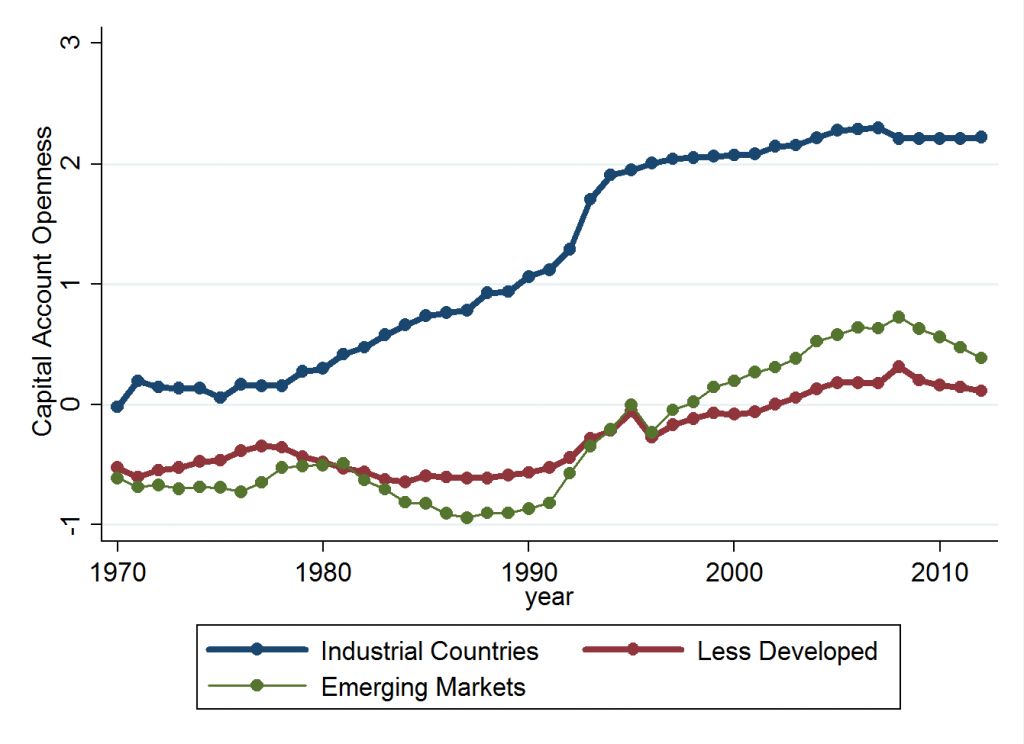
Figure 1 depicts the evolution of this measure of financial openness for three groups of countries:
Figure 1: Evolution of KAOPEN for Different Income Groups. Higher values indicate greater financial openness.
To recap:
The Chinn-Ito index (KAOPEN) is an index measuring a country’s degree of capital account openness. The index was initially introduced in Chinn and Ito (Journal of Development Economics, 2006). KAOPEN is based on the binary dummy variables that codify the tabulation of restrictions on cross-border financial transactions reported in the IMF’s Annual Report on Exchange Arrangements and Exchange Restrictions (AREAER). This update is based on AREAER 2013, which contains the information on regulatory restrictions on cross-border financial transactions as of the end of 2012.
The CI index is a de jure measure, based on written (and self-reported) information (a characteristic it shares with most extant indicators). Moreover, it does not contain as much detailed information regarding the types of restrictions, nor does it differentiate between restrictions on inflows and outflows. On the other hand, it does cover a wider range of countries over a longer span than all others. (See Quinn, Schindler, and Toyoda (2011) for a discussion of the various measures.)
Capital openness measures are useful for assessing the international trilemma — the proposition that one cannot simultaneously pursue full financial openness, exchange rate stability, and monetary autonomy — as discussed here.
It’s of interest that financial openness has declined for emerging market economies (on the whole — this is a simple average); this result is not inconsistent with the increasing use of capital controls to stem capital inflows.[1]
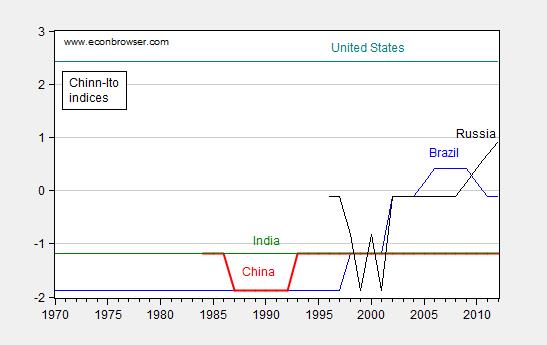
Financial openness is germane to the prospects for the rise of new international currencies (e.g., Eichengreen (2013), Chinn (2012), Ito and Chinn (2014), and Prasad (2014)). Most studies concur that one of the pre-requisites for international currency status (thus far) is financial openness, so it’s useful to inspect the evolution of openness in the BRICs (compared to the US).
Figure 2: Chinn-Ito KAOPEN series for Brazil (blue), Russia (black), India (green), China (India) and US (teal). Source: Chinn-Ito.
It’s interesting that China and India have made no progress toward liberalization in recent years on paper. Russia was liberalizing at least through 2012. What happened in 2013 is a question that will have to await the next AREAER.
The data files (in Stata, Excel), along with documentation, are available here. Previous posts on the Chinn-Ito index here and here.


China doesn’t want its currency to appreciate too much, which would cause its exports to become more expensive and its imports cheaper.
It needs to maintain export-led growth to maintain a high level of employment.
A “creative-destruction” process may cause a massive rebellion against the communists in power, before it’s completed.
Chinese work very hard for slow improvements in living standards, since much of their work is basically for free, and will retire very poorly, much more poorly than the Japanese.
Sorry, China, There Is No Short Cut To Economic Greatness
Jan. 26, 2010
“The government that magically managed to report 6-8% GDP growth in the midst of the financial crisis, when its exports were down over 25%, tonnage of goods shipped through its railroads was down by double digits, and its electricity consumption was falling like a rock. It is hard to manufacture 8% more widgets with a lot less electricity…China did not suddenly become energy efficient during the financial crisis.
This is a government that will go to great length to maintain appearances to keep its ideology going. After all, it censors what its citizens may or may not read and imprisons the ones that write anti-government articles.
China will do anything to grow its economy, as the alternatives will lead to political unrest…Since China lacks the social safety net of the developed world, unemployed people are not just inconvenienced by the loss of their jobs, they starve (this explains the high savings rate in China) and hungry people don’t complain, they riot.
The Chinese government controls the banks, thus it can make them lend, and it can force state-owned enterprises (a third of the economy) to borrow and to spend. Also, since the rule of law and human and property rights are nascent in its economic and political system, China can spend infrastructure project money very fast – if a school is in the way of a road the government wants to build, it becomes a casualty for the greater good.
China has spent a tremendous amount of money on infrastructure over last decade and there are definitely long-term benefits to having better highways, fast railroads, more hospitals, etc. But government is horrible at allocating large amounts of capital, especially at the speed it was done in China. Political decisions (driven by the goal of full employment) are often uneconomical, and corruption and cronyism result in projects that destroy value.
Infrastructure and real estate projects are where you get your biggest bang for the buck if your goal is to maintain employment, since they require a lot of unskilled labor; and this is where in the past a lot of Chinese money was spent. This also explains why, in 2009, new floor space constructed was up 100% and residential real estate prices surged 25%. And this explains why they keep building skyscrapers even though the adjacent ones are still vacant.
To make things worse, before the financial crisis and enormous stimulus ($586 billion), China was already suffering from what I call late-stage-growth obesity, inefficiencies that are a byproduct of high growth rates sustained for a long period of time. Though Chinese growth in the past was high, in its late stages the quality of growth has been low.
For example, in an echo of past Chinese government asset-allocation decisions, China built the largest shopping mall in the world, the South China Mall, that is 99% vacant, years after construction. China also built a whole city, Ordos, in Inner Mongolia, on spec for million residents who never appeared.
The inefficiencies are also evident in industrial overcapacity. According to Pivot Capital, Chinese excess capacity in cement is greater than the combined consumption by the US, Japan, and India combined. Also, Chinese idle production of steel is greater than the production capacity of Japan and South Korea combined. Similarly disturbing statistics are true for many other industrial commodities. The enormous stimulus amplified problems that already existed to financial-crisis levels.”
This is an interesting statement, from 2013, by a Rhodes Scholar Sanjeev Sanyal, from India (the article above was written by a Russian finance expert, who immigrated to the U.S.),
“The current account of any economy can be seen as the difference between its investment rate and its savings rate. In 2007, the US had a savings rate of 14.6 per cent of the gross domestic product (GDP) but an investment rate of 19.6 per cent. This was the ultimate source of its current account deficit. In contrast, China had a fixed investment rate of 41.7 per cent of GDP and a savings rate of 51.9 per cent. This was reflected in a large surplus.
Since 2007, the US deficit has narrowed — but not because of better savings. The country’s overall savings rate has actually fallen below 13 per cent of GDP owing to worsening government finances. Instead, we have seen a collapse in investment activity. Meanwhile, China’s savings rate remains stubbornly high. The surplus has narrowed because the government’s encouragement ramped up investment even higher to around 49 per cent of GDP. In other words, the factors underlying the pre-crisis imbalances have not been unwound and, if anything, have been exacerbated. The US saves even less today and China invests even more.”