As I begin teaching finance in the new semester, I am highlighting the key puzzle of our times, discussed by Jim in his last post, with this graph:
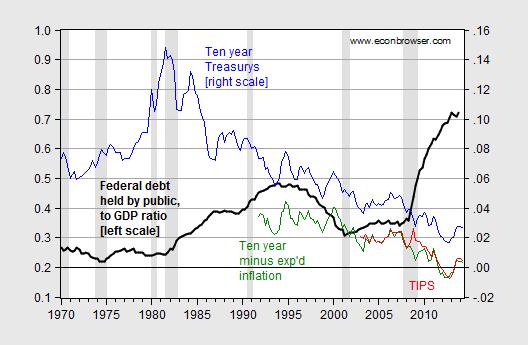
Figure 1: Ratio of Federal debt held by public to GDP (bold black, left scale), ten year constant maturity Treasury yield (blue, right scale), ten year Treasury yields minus ten year median expected inflation (green, right scale), and TIPS ten year constant maturity yields (red, right scale). NBER defined recession dates shaded gray. Source: Treasury, Federal Reserve Board, BEA (2014Q2 2nd release), Survey of Professional Forecasters, NBER, and author’s calculations.
The key point of this graph is that the US debt-to-GDP ratio has risen, starting upward in 2008Q3; and yet nominal ten year yields have continued to decline, despite the warnings of Paul Ryan, and others, contra the crowding out hypothesis. Some of this decline can attributed to a decline in expected inflation, but not by any means most. Real interest rates calculated using yields minus expected inflation have also declined. Aside from the financial turmoil surround Lehman’s collapse, TIPS yields confirm the decline.
Why have government yields declined so much, despite the reversal in the debt-GDP ratio engineered by the Bush Administration (remember EGTRRA and JGTRRA?). About ten years ago, Jeff Frankel and I started investigating this puzzle [1]. We regressed US yields on actual and expected US debt-GDP ratios (annual data), and found that up to 2002, the canonical regression worked well. But incorporating data up to 2006, the correlation broke down — and yields were over-predicted. This finding was one manifestation of the “conundrum”. Only by incorporating foreign purchases of US Treasurys could we restore the correlation (and fit the data).
So, looking forward, what can we expect to happen to yields, given foreign and Fed holdings of US Treasurys? First a regression over the 1991Q4 to 2002Q4 period.
rt = 0.026 + 0.071×dt -0.348×fedt – 0.067×fort + 0.253×yt-1
Adj.-R2 0.34, SER = 0.005, DW=0.91, n=45. bold face denotes significance at the 10% MSL, using HAC robust standard errors. Where r is the ten year real interest rate, d is debt-to-GDP, for is foreign and international holdings of Treasurys and Fed is holdings by the Federal Reserve Banks (both normalized by GDP), and y is the output gap, measured using the log of the ratio of GDP to the CBO estimate of potential GDP (February 2014 release).
For each 1 percentage point increase in the debt-to-GDP ratio, the Treasury yield rises by 0.07 percentage points. This estimate is similar to the figure obtained in Chinn and Frankel for the period 1988-2006. Interestingly, the coefficients on foreign and Fed holdings are not statistically significant.
Expanding the sample to 2014Q1, one obtains the following results:
rt = 0.023 + 0.073×dt –0.159×fedt – 0.130×fort + 0.223×yt-1
Adj.-R2 0.83, SER = 0.005, DW=0.76, n=90. bold face denotes significance at the 10% MSL, using HAC robust standard errors.
Including a time trend does not change the results (and the coefficient on the time trend is not significant in itself). Interestingly, the hypothesis that for and Fed are equal and opposite sign from that on d cannot be rejected at conventional levels (similar to Kitchen and Chinn (2012)).
The fit is much better using the full specification, as opposed to merely debt and output gap. This is shown in Figure 2.
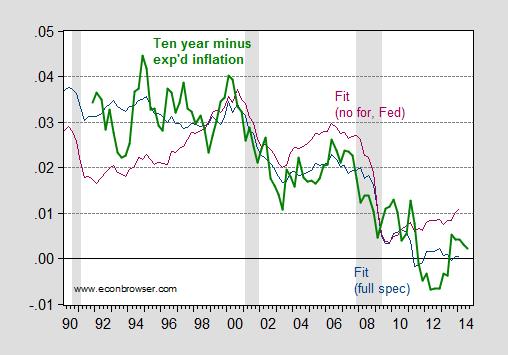
Figure 2: Ten year Treasury yields minus ten year median expected inflation (bold green), fitted values using full specification (dark blue), and using partial specification (purple). NBER defined recession dates shaded gray. Source: Federal Reserve, Survey of Professional Forecasters, NBER, and author’s calculations.
(Note: it would be preferable to use foreign official sector holdings, as opposed to foreign (private and public) holdings, but this is the series I could get on quick notice.)
While Fed holdings will stabilize and shrink over time, it’s not clear to me that foreign holdings expressed as a share of US GDP are going to shrink.
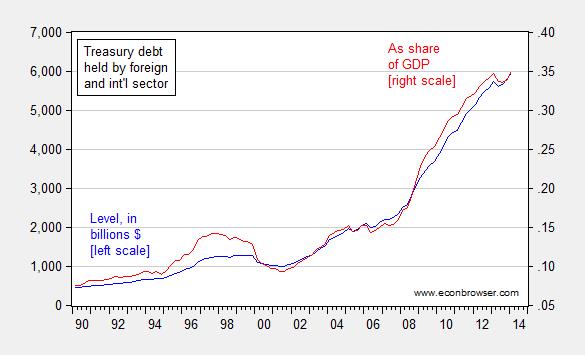
Figure 3: US Treasury debt held by foreign and international sector, in billions $ (blue, left scale), and as share of GDP (red, right scale). Source: Flow of funds, BEA, and author’s calculations.
In fact, in the short term, one can imagine elevated holdings of US Treasurys, given geopolitical concerns. Over the longer term, the demand for “safe assets” (see definition here and here) will likely continue, as financial development is a very slow process (and regressing in places like Russia).
In sum, I am not so sure the case for a rebound of long term rates to the norms of the post War era is so strong.
Update, 9/3 9:15AM Pacific: See also DeLong/WCEG, who brings my attention to the blog review by Cohen-Setton/Bruegel.
The federal government has been selling bonds and the Federal Reserve has been buying bonds.
The U.S. has become more efficient in production and “capital creation,” particularly since the quick and massive “creative-destruction” process mostly from 2000-02.
The S&P 500 had 20 consecutive quarters of double-digit earnings growth in the mid-2000s.
However, it seems, it has become more difficult for small businesses to become big businesses, and there are fewer business start-ups.
Related article:
Profits Without Production
Paul Krugman
June 20, 2013
“Economies do change over time, and sometimes in fundamental ways.
“…the growing importance of monopoly rents: profits that don’t represent returns on investment, but instead reflect the value of market dominance.
…consider the differences between the iconic companies of two different eras: General Motors in the 1950s and 1960s, and Apple today.
G.M. in its heyday had a lot of market power. Nonetheless, the company’s value came largely from its productive capacity: it owned hundreds of factories and employed around 1 percent of the total nonfarm work force.
Apple, by contrast…employs less than 0.05 percent of our workers. To some extent, that’s because it has outsourced almost all its production overseas. But the truth is that the Chinese aren’t making that much money from Apple sales either. To a large extent, the price you pay for an iWhatever is disconnected from the cost of producing the gadget. Apple simply charges what the traffic will bear, and given the strength of its market position, the traffic will bear a lot.
…the economy is affected…when profits increasingly reflect market power rather than production.
Since around 2000, the big story has been one of a sharp shift in the distribution of income away from wages in general, and toward profits. But here’s the puzzle: Since profits are high while borrowing costs are low, why aren’t we seeing a boom in business investment?
Well, there’s no puzzle here if rising profits reflect rents, not returns on investment. A monopolist can, after all, be highly profitable yet see no good reason to expand its productive capacity.
And Apple again provides a case in point: It is hugely profitable, yet it’s sitting on a giant pile of cash, which it evidently sees no need to reinvest in its business.
Or to put it differently, rising monopoly rents can and arguably have had the effect of simultaneously depressing both wages and the perceived return on investment.
If household income and hence household spending is held down because labor gets an ever-smaller share of national income, while corporations, despite soaring profits, have little incentive to invest, you have a recipe for persistently depressed demand. I don’t think this is the only reason our recovery has been so weak — but it’s probably a contributory factor.”
There’s a bit of “Blame it on Beijing” here, is there not?
It seems pretty clear that there has been a whopping amount of foreign money looking for a home, which has ended up in US government debt.
It would also be interesting to see the demand for debt, including corporate debt.
Also, the relationship to exchange rates might be worth considering.
In any event, Gail Tverberg might argue something like this: A constrained oil supply reduces growth expectations, particularly in the OECD, thereby reducing the demand for debt (and equity) which is used to fund growth. Meanwhile a rapidly growing China is generating large savings which are looking for a home. Same for the oil exporters. Therefore, there is a structural mismatch between the supply of funds and the demand for funds, resulting in low interest rates.
I agree about the lowered growth expectations; I agree about the excess supply of funds looking for a home. I am less convinced about the demand for credit.
Gail Tverberg might argue
Gail “the Actuary” Tverberg is detached from reality. She’s convinced that Peak Oil will cause us all to abandon modern civilization and go back to subsistence farming. She seems to think that manufacturing, and rail and water freight transportation, simply didn’t exist before oil.
A constrained oil supply reduces growth expectations
That seems to be an argument about perceptions: I don’t see that expectation in the investing community (which is appropriate).
oil exporters…generating large savings which are looking for a home
Oil exporters are spending all of their revenues, and not saving anything.
It hasn’t constrained debt, but I suppose it is the Fed that has kept rates low enough to finance M&A, buy backs, and bank re-cap. But it has constrained investment in productive capital, so I guess your point is still valid.
I think rates will be constrained by discretionary disposable income (no point in investing if people can afford more product), and off course your oil constraint is part of that.
Is it strange that demand side economic analysis does not normally consider demand when considering currency expansion and interest rates. The primary way that the interventionists bring about lower inflation, lower prices and lower interest rates is to hamper the productive process. What we now see is stagnation in business and production in general. New start-ups are declining and established firms are closeing.
An objective look at Menzie’s numbers seems to reinforce this. Foreign sector demand for US Treasuries is increasing as domesitc demand declines which implies a decrease in domestic investment resources and demand. Most of the foreign sector demand is by foreign central banks, not by productive enterprises.
Menzie’s conclusion is basically correct though it is not based on demand. This is because the theory of demand side economics is based on monetary expansion not increased production. The source of this demand is obscured. Low long-tern rates is a product of economic stagnation and the resulting stagnation in demand.
Ever considered the arguments of MMT economics? They have understood this dynamic for some time. If federal debt is not sufficient to raise demand, in the face of financial implosion, inequality effects on consumption, and continued drains in foreign exchange, then inflation and rates stay low.
Dear Prof. Chinn,
Why is the ratio of debt to GDP the measure you use to suggest the macroeconomic significance of the debt?
As debt is in $ and GDP in $/year, the ratio has units of years. That is, it tells us how many years it would take to pay off the debt if our entire GDP went to paying it off. (You can’t do your favorite first step and take the logarithm either.)
A bank considering offering a mortgage compares the monthly payments to the borrower’s income, not the amount of the loan to the borrower’s income. That is, the comparison is dimensionless, comparing like quantities.
A bank will also compare the amount of the loan to the value of the collateral, the present market price of the house. Again this compares like quantities.
What is the ratio of Uncle Sam’s income to his debt and interest payments?
What is the ratio of Uncle Sam’s debt to his assets?
Furthermore, Uncle Sam’s debts are public assets. What is the ratio of Uncle Sam’s debts to total public assets?
When the Fed buys T-bills and other Treasury debt, do those assets count as some of Uncle Sam’s assets or his debts?
Unlike a person who wishes to buy a house with a mortgage, is there any limit to the debts Uncle Sam can pay off, if he wishes to?
Thanks for your answers.
Is the correlation of MZM velocity to 10 year yields ( from fred site) a valid correlation recognized by economist or is it a spurious result?
[I also include the less impressive correlation of GDP/money stock)
http://research.stlouisfed.org/fred2/graph/?g=Jdn
There appears to be a relationship going back to 1960 here between MZM velocity and 10 year treasury yields but I’m not sure which if either is leading the other. That is, are the falling interest rates (and disinflation) leading to a general decrease in money velocity in the economy ? Or is cost of capital (interest rates) and velocity falling because money supply is growing too fast?
If the relationship between MZM and interest rates is valid, then we may be able to write the generic money velocity formula in the form of
V*M = T*P= interest rates*mystery variable =GDP
I suppose interest rates maybe somehow reflected in P (price component). But to me this suggest there is a “linkage” and some sort of equivalency between targetting GDP, money supply, interest rates, (Price via inflation) etc.
I have a very good regression model of bond yields that I have used for years and it has said that bonds were cheap all this year.
I noticed the tight relationship between MZM velocity and yields several years ago and tried to incorporate that into my bond valuation model.
But the regression analysis always said that MZM velocity was an insignificant factor in explaining bond yields.
I would add, that even thought federal trade deficit is still negative it has started to improve since 2008 so there is no dangerous runaway spending that some may claim the debt/GDP implies.
And stating the obvious, the amount of treasuries held by foreigners will be dependent on trade and the size of US trade deficit (Triffin Dilemma). The reserve currency earned by foreigners on their exports is exchanged by those companies at their own central bank for local currency. The foreign central bank who holds these reserve notes, then exchanges them for safe assets (treasuries) denominated in the reserve currency. Since 2006, the trade deficit has been shrinking. And I suspect the trade deficit (rather then the raw debt/GDP) is a more sensitive driver to the cost of capital (interest rate) as that better measures if credit being extended is being used to support GDP in the form of domestic production (investment in local jobs etc) [debt for economic growth) or foreign consumption growth (trade deficit).
Okay, I get how an influx of foreign reserves might hold down US Treasury interest rates. But that doesn’t explain why interest rates are globally low. The conundrum is global, not just US.
As the Wall Street Journal editorial page loves to point out when the President is a Republican, the correlation between bond yields and the federal deficit is negative.
But generally the federal deficit rises when private debt is falling and this decline is generally larger than the increase in government debt.
So falling interest rates and a rising federal debt should be accepted as the norm because it is usually accompanied by total debt contracting.
On page C8 of the 9-4-2014 WSJ there is an article discussing the “Fed’s Rate Shadow” developed by Wu & Xia, as previously mentioned by Professor Hamilton. The WSJ thinks it is well worth considering the gap between the fed funds and shadow rate.