There is a lot of discussion of how economic slack is fast disappearing, and I expect a lot of push on this view, given continued rapid growth in GDP as reported in today’s second release for 2014Q3. This view seems counter to (1) the CBO estimate of potential GDP and (2) the slow pace of inflation. My suggestion is that there remains a substantial amount of slack out there.
In Figure 1, I plot log GDP as reported in today’s release, and potential GDP as estimated by the CBO in its August report.
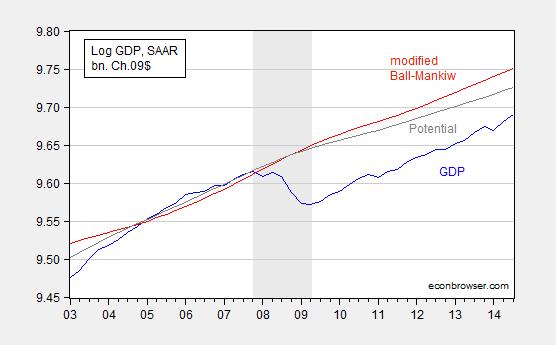
Figure 1: Log GDP (blue), potential GDP as estimated by CBO (gray), and an estimate of potential GDP estimated by use of a modified Ball-Mankiw (2002) method (red). NBER defined recession dates shaded gray. Source: BEA 2014Q3 2nd release, CBO, An Update to the Budget and Economic Outlook (August 2014), NBER, and author’s calculations.
According to the CBO’s estimate of potential (if readers find my repetitive use of the adjective “estimated” tiresome, blame reader Tom), the current (estimated) output gap is -3.5% (in log terms). As I have discussed, there are a variety of other methods than the CBO’s (which is essentially a production function approach), including statistical detrending methods such as the Hodrick-Prescott filter (see [1] [2] [3])
I am going to use economics to infer the output gap and hence the level of potential GDP, i.e., exploiting the expectations-augmented Phillips curve. This means I am appealing to the following data.
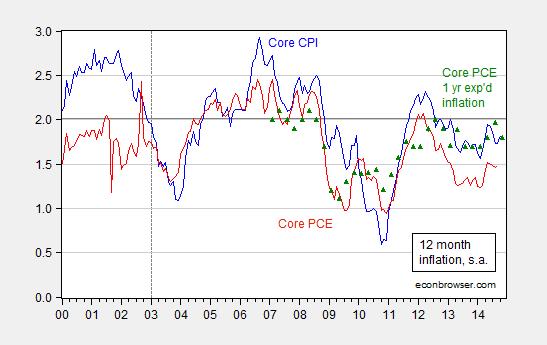
Figure 2: Year-on-year core CPI inflation (blue), core personal consumption expenditures (PCE) deflator (red), and expected one year PCE inflation over the next year (green triangles). Source: BLS, BEA via FRED, Survey of Professional Forecasters.
The methodology is basically that forwarded by Ball and Mankiw (JEP, 2002), which involves inverting a simple expectations-augment Phillips Curve (without supply shocks, but allowing for random shocks), and assuming adaptive expectations (consistent with the accelerationist hypothesis).
(1) πt = πet – a(Ut-U*t) + vt
(2) Δ πt = a U*t – a Ut + vt
(3) U*t + vt/a = Ut + Δ πt/a
Notice that NAIRU plus a random error is equal to actual unemployment plus the change in inflation divided by a. This suggests that NAIRU can be estimated by filtering the object on the right side of the last equation.
I follow the same procedure, replacing NAIRU with potential GDP, and using core personal consumption expenditure deflator inflation (q/q at annualized rates) for π.
(4) y*t – vt/a = yt – Δ πt/a
I estimate the analogous a parameter over the 1967Q1-2002Q4 period (so I’m assuming the accelerationist model holds over this sample); the estimate I obtain is approximately 0.08. (See this post for an earlier implementation.) I further assume that expected inflation equals 2% over the 2003Q1-2014Q3 period — which is pretty close to the average 1-year-ahead CPI inflation rate reported by the Survey of Professional Forecasters over this period. In other words, I am assuming that inflation expectations are now well-anchored. Hence, the variable on the RHS of (4) is:
(5) yt – (πt-0.02)/a
I then HP filter this variable [edits 11/26, 8:40am] using the default smoothing parameter for quarterly data suggested by Hodrick and Prescott, to obtain an estimate of potential GDP shown in Figure 1 (red line).
What is interesting is not the exact path of estimated potential GDP, but rather that — using this method — the (estimated) output gap as of 2014Q3 is -6.0% (log terms). That is not to say this estimate is “better” than the others; just that there are various indicators of slack — some of which indicate more slack than others –, and it makes sense to appeal to several measures in these uncertain times, as argued by Elias, Irvin, and Jordà.
Implications for these findings for the implementation of the Taylor rule discussed in this Reuters article.
Update, 11/26 3:25PM Pacific: With the OECD’s release of the November 2014 Economic Outlook, we now have three estimates of the output gap at an annual frequency. I plot these, plus my version of the Ball-Mankiw approach in Figure 3 below.
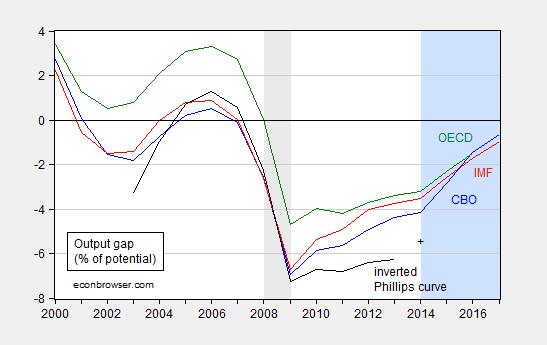
Figure 3: Output gap in percentage points of potential output from CBO (blue), IMF (red), OECD (green), and from author’s estimates (black). + for 2014 is for 2014Q3. Gray shaded area denotes NBER defined recession dates. Light blue shaded area denotes forecasts. Source: CBO, An Update to the Budget and Economic Outlook (August 2014), IMF, World Economic Outlook database (October 2014), OECD, Economic Outlook (November 2014), and author’s calculations.
The degree of economic slack indicated by the three organizations ranges from -4.2% to -3.2% of potential GDP.
Why was inflation so low in the late 90’s when output was supposedly above normal until 2000? Maybe you need to see structural issues a little more clearly.
I do wonder how much these macroeconomic models take into account the increasing export/import share of the economy for both goods and services, the effects of strong dollar trends (with the probability that the dollar is overvalued even in its periods of decline due to it being the international reserve currency), and large surplus labor pools that exist outside the United States but which U.S. firms can tap into to produce goods and services for domestic demand. In the 1990s, economists were surprised that inflation did not take off even as U.S. unemployment fell below 5% and real wages started appreciating, without appreciating how Asian financial crisis, a very strong dollar, and China’s subsequent admission to the WTO allowed firms to sustain profit margins while keeping prices low. Twenty years later, the U.S. is even more integrated into a “global economy.” What is the NAIRU under these circumstances?
I’m not sure I understand the methodology. If you assume expectations become anchored after 2003, the Phillips curve in difference form collapses since it comes from adaptive expectations. We are back to the “naive” Phillips curve with no “acceleration.” So where does the \Delta \pi term come from for your HP filter? You should be able to just estimate the PC for 2003-2014 and estimate the output gap directly from the inflation print, I think. Maybe I’m missing something….
tom m: Excellent point; I made a mistake and omitted the change in the formula for the variable that has to be HP-filtered that occurs when expected inflation is 2%, rather than the lagged inflation rate. See the revised text in small bold type.
Thanks for flagging the error!
While I agree that output is likely well below potential, its not clear whether inflation is really a good measure of that. Summer’s talk on “secular stagnation” is in part driven by this point, and regardless of what one might think of that thesis the original question – why inflation was so low in the 1990s or the mid-2000s, should give us pause. Given that economics still does not fully understand inflation and its dynamics, and that there are some meaningful empirical failings of the Phillips curve, I’m a bit suspicious of using it as a measure of potential GDP. That said, I think labor market conditions, business balance sheets, and measures of long trend growth (excluding bubble years of course) all suggest we are well below potential, so inflation is besides the point. A more interesting question is whether inflation will ever come back.
6% seems a bit on the high side to me. But it’s not out of the real of the possible.
Menzie
You referenced the Reuter’s article which was okay. I suggest you could also reference the excellent article you brought here to econbrowser,
“Guest Contribution: Taylor Rule Legislation”
In addition, I would suggest links to Taylor’s blog,, a scroll of postings will find a variety of comments on the legislation and some of the objections. This would provide more background connected to your final line, “Implications for these findings for the implementation of the Taylor rule discussed in this Reuters article.”
“Economics One A blog by John B. Taylor”
Ed
I see my link to the guest contribution to econbrowser failed, I’ll try again and hope.
“Guest Contribution: Taylor Rule Legislation”
If the rate of inflation is overstated and the unemployment rate is understated, then the output gap is larger.
It should be noted, many older workers are working longer, postponing retirement.
And, the adjustments in quality improvements of output may be smaller and slower.
So, the permanent destruction of potential output may be much less than many economists estimated.
On this Thanksgiving day, thanks to Professors Chinn & Hamilton for their efforts to educate readers of this blog. As a definite amateur I appreciate their efforts.
Can’t be the horizontal drilling phenomena keeping inflation low. It’s just a scam, fraud or whatever head-in-the-sand induced rebuff. Imagine where we would be without the extra 3.5 million barrels per day of production.
luke, do not confuse commodity prices due to supply and demand with inflation. rising prices in itself is not inflation, depending upon what causes the increase in prices.
Not sure I really agree that OECD, IMF, and CBO estimates are sufficiently independent to consider them 3 different estimates (herding around the same estimate?). Plus, remember back when the IMF was pushing expansionary fiscal austerity?
There should be a *considerable* amount of uncertainty about potential output (for may reasons). When I see three estimates so close, before we see signs of wage inflation, it does not make me comfortable – quite the opposite.
Even worse, these estimates can become self fulfilling if the Fed prematurely tightens. None of it really matters if we have a FOMC afraid of 1.99% inflation unwilling to test uncertainty to the upside.
On the plus side, I see the Fed making the same mistake it made in 2008, except this time to the benefit of the economy. Now, with oil prices down, they seem more afraid of a global recession, disinflation, and more willing to extend policy longer. Whereas in 2008, they overreacted to commodity price inflation and kept rates too high for too long.
Low oil prices ought to give them an excuse to do what they should be doing anyway – on hold for a considerably longer period.
The FOMC really should not be reacting to supply side inflation. But if it means we reduce unemployment faster, I’ll take it.
low oil prices will do the opposite of what you think. this is still a oil based economy and when you relearn that lesson, call me.
Only sociopaths advocate higher inflation (which hurts the middle class and the poor).
Incidentally these are the same people that advocate more QE (which enriches the rich).
Central bank and government policy since 2008: enrich the rich, gut the middle class, move jobs to low wage countries and be amazed why the economy is in the crapper.
marc, i suppose deflation is beneficial to the middle class as well? in a debt laden society, inflation helps the middle class out of debt better than deflation. in your words, only a “sociopath” would think deflation is beneficial to the middle class, who hold most of their assets and debts in 401k’s and housing.
While I agree with the statement that most of the middle classes debt is in residential real estate and what little equity/assets they have are also tied to the same market, you quite mistaken to think that the middle class has any real assets in 401Ks. Of the people who have 401K’s median balance is about $101,000. Is financial inflation from QE helping these people ? Possibly, but it is primarily help the upper 1% and not the next 40% behind them. As far as helping the future generations build wealth, high residential real estate prices is a becoming a barrier to household formation and lower residential real estate prices will give households better monthly cash flow to invest in the future and not pad the financial companies pockets in the form of debt slavery.
brad, you need to think hard about the effects of deflation. we had a very clear case study in the effects of deflation on the economy during the great recession. compare that with a bout of even mild inflation. which situation would you like to repeat? your priority needs to be the elimination of deflationary environments, even if that means absorbing some inflation. very asymmetric risk/reward scenarios.
“lower residential real estate prices will give households better monthly cash flow to invest in the future and not pad the financial companies pockets in the form of debt slavery.” you have seen very clearly lower RE prices resulting from a deflationary environment do not produce the results you believe will occur.