The October employment release was much in line with expectations. I will focus my observations on a few observations:
(1) Alternative indicators indicate better improvement than headline (estimated) nonfarm payroll employment; (2) estimated nonfarm payroll employment has been revised upward over the past couple months; (3) estimated employment compensation growth remains muted, especially after taking into account catch-up and estimated productivity gains.
(If you are wondering about the pervasive use of the adjective “estimated”, see this comment by reader Tom.)
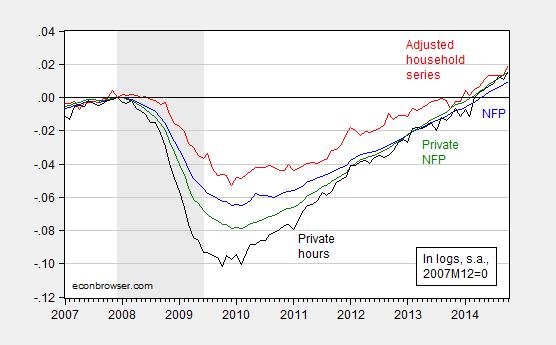
Figure 1: Log nonfarm payroll employment as estimated by the BLS in the establishment survey (blue), and as estimated by the BLS in the household survey, adjusted to conform to the NFP concept (red), and private nonfarm payroll employment as estimated by the BLS in the establishment survey (green), and index of average weekly hours for production and nonsupervisory workers as estimated by the BLS in the establishment survey (black), all seasonally adjusted by the BLS, normalized by the author to 2007M12=0. Recession dates as estimated and defined by the NBER Business Cycle Dating Committee shaded gray. Source: BLS via FRED, BLS, NBER, and author’s calculations.
Note that the cumulative growth since 2007M12 of the (estimated) household series adjusted to conform to the NFP concept remains substantially above that of the officially estimated NFP series — nearly 1% in log terms (the actual level is about 0.5% in 2014M10). In the previous recovery, many observers argued that one should pay special heed to this indicator, given the difficulties in the birth/death model; strangely, I have not heard those same observers make similar comments this time around. The usual caveats apply to the household series — the noise associated with estimates derived on this survey are relatively large.
The second observation: the (estimates of) nonfarm payroll employment have been consistently revised upward over the past couple months.
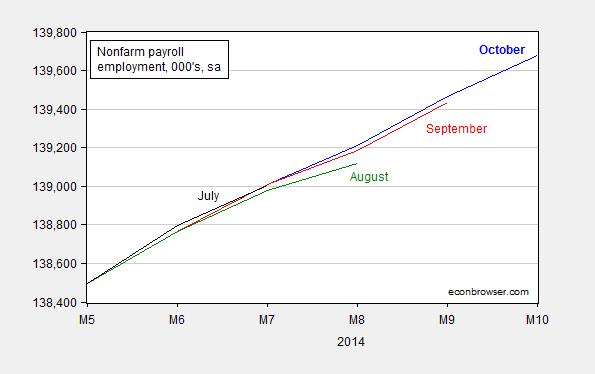
Figure 2: Nonfarm payroll employment as estimated by the BLS in the establishment survey October release (blue), September (red), August (green) and July (black). Source: BLS via FRED.
Third observation: wages are rising, but so too are prices.
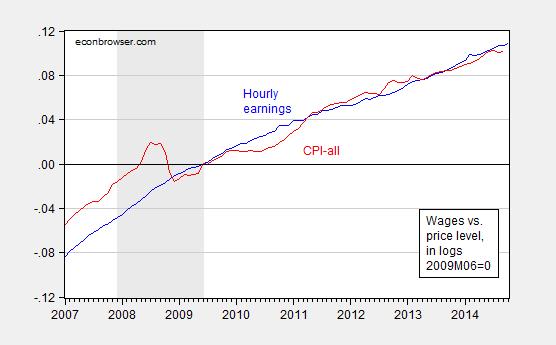
Figure 3: Log average hourly earnings for production and nonsupervisory employees, as estimated by the BLS in the establishment survey October release, and log CPI-all (red), both normalized to 2009M06=0. Recession dates as estimated and defined by the NBER Business Cycle Dating Committee shaded gray. Source: BLS via FRED, NBER and author’s calculations.
In order to assess the inflationary impact of rising wages, several things must be taken into account; the first is the anchoring of inflation expectations (if they are anchored, then rising wages tend to shift the income share). The second, even if inflation expectations were unanchored, labor productivity is an important determinant of inflation. Hence, unit labor costs, which are labor costs adjusted by productivity, is the more relevant variable. In Figure 4, I reprise a graph (slightly modified) based on data from the recently released employment and costs release.
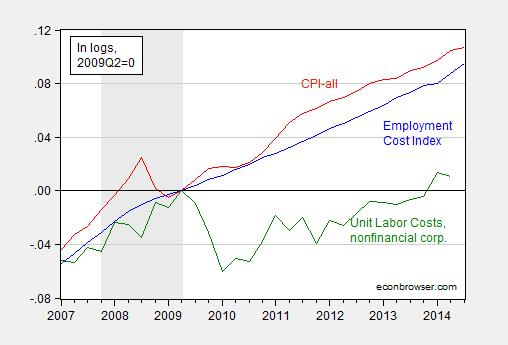
Figure 4: Log estimated Employment Cost Index (blue), estimated CPI-all, quarterly average of monthly data (red), and estimated unit labor cost index for nonfinancial corporations (green), all normalized to 2009Q2=0. Recession dates as estimated and defined by the NBER Business Cycle Dating Committee shaded gray. Source: BLS, and BEA via FRED, NBER, and author’s calculations.
That is, estimated unit labor costs in the nonfinancial corporate sector in 2014Q2 are only 1.1% higher than the previous peak five years ago.
For more on the employment release, see Furman/CEA, Chad Stone/CBPP, McBride/Calculated RiskTed Duy, Portlock/WSJ RTE, Timiraos & Zumbrun/WSJ RTE.
Update, 4:20PM Pacific: A querulous comment by Anonymous doubtful that employment growth is greater under Obama than Bush prompts me to post this Figure 5.
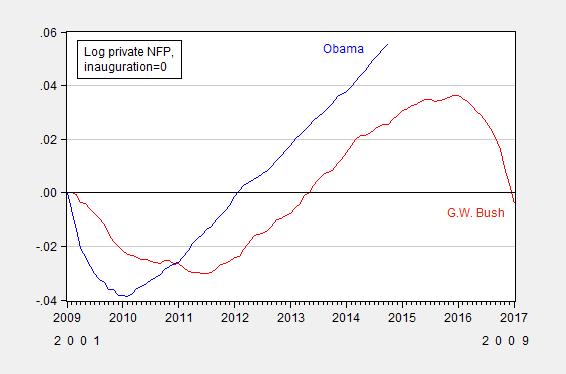
Figure 5: Log private nonfarm payroll employment for Obama (blue) and G.W. Bush (red), normalized to 0 at inauguration. Source: BLS via FRED, and author’s calculations.
There is a decline in a percentage but there is no significant improvement in employment. Employees are still leaving the workforce with African-Americans seeing 114,000 dropping out to go on government assistance. This is a double hit to the economy. Not only do we lose productive employees who add to our economy we add the the rolls of those who are pulling resources out of the economy for unproductive activity. Our government is doing a serious disservice by falsifying the employment condition in our country. Policy changes that could actually help are being delayed with false information.
Ricardo,
Do you have any data to back up these claims?
Ricardo: “Employees are still leaving the workforce with African-Americans seeing 114,000 dropping out to go on government assistance.”
Uh, oh. Ricardo attempting to do math again. Once again (didn’t he learn anything from the last time) Ricardo attempts to subtract the difference in two months “Not in Labor Force” numbers to get a labor participation number. That is just wrong.
He was corrected on this mistake once, but apparently he is too dim to ever learn.
Ah, now I see that he has simply cut and pasted from wingnut Brent Bozell’s Conservative News Service, the blind leading the blind — sort of a stupid people’s affinity group.
Excellent post. No traction. You should have added “Lunatic” or “Bush’s Fault” to the title, and the stream of comments would have been endless.