Reader Mike V castigates me for over-use of logs.
I’m not at all averse to logs, but they have a time an a place. You are trying to point out relatively small changes in income over a short time-series – not the nearly exponential changes in the S&P 500 over the last 100+ years.
Let me provide some examples of where it’s useful to use logs. First, consider the dollar’s value over the course of a year and a half (somewhat less than 100+ years).
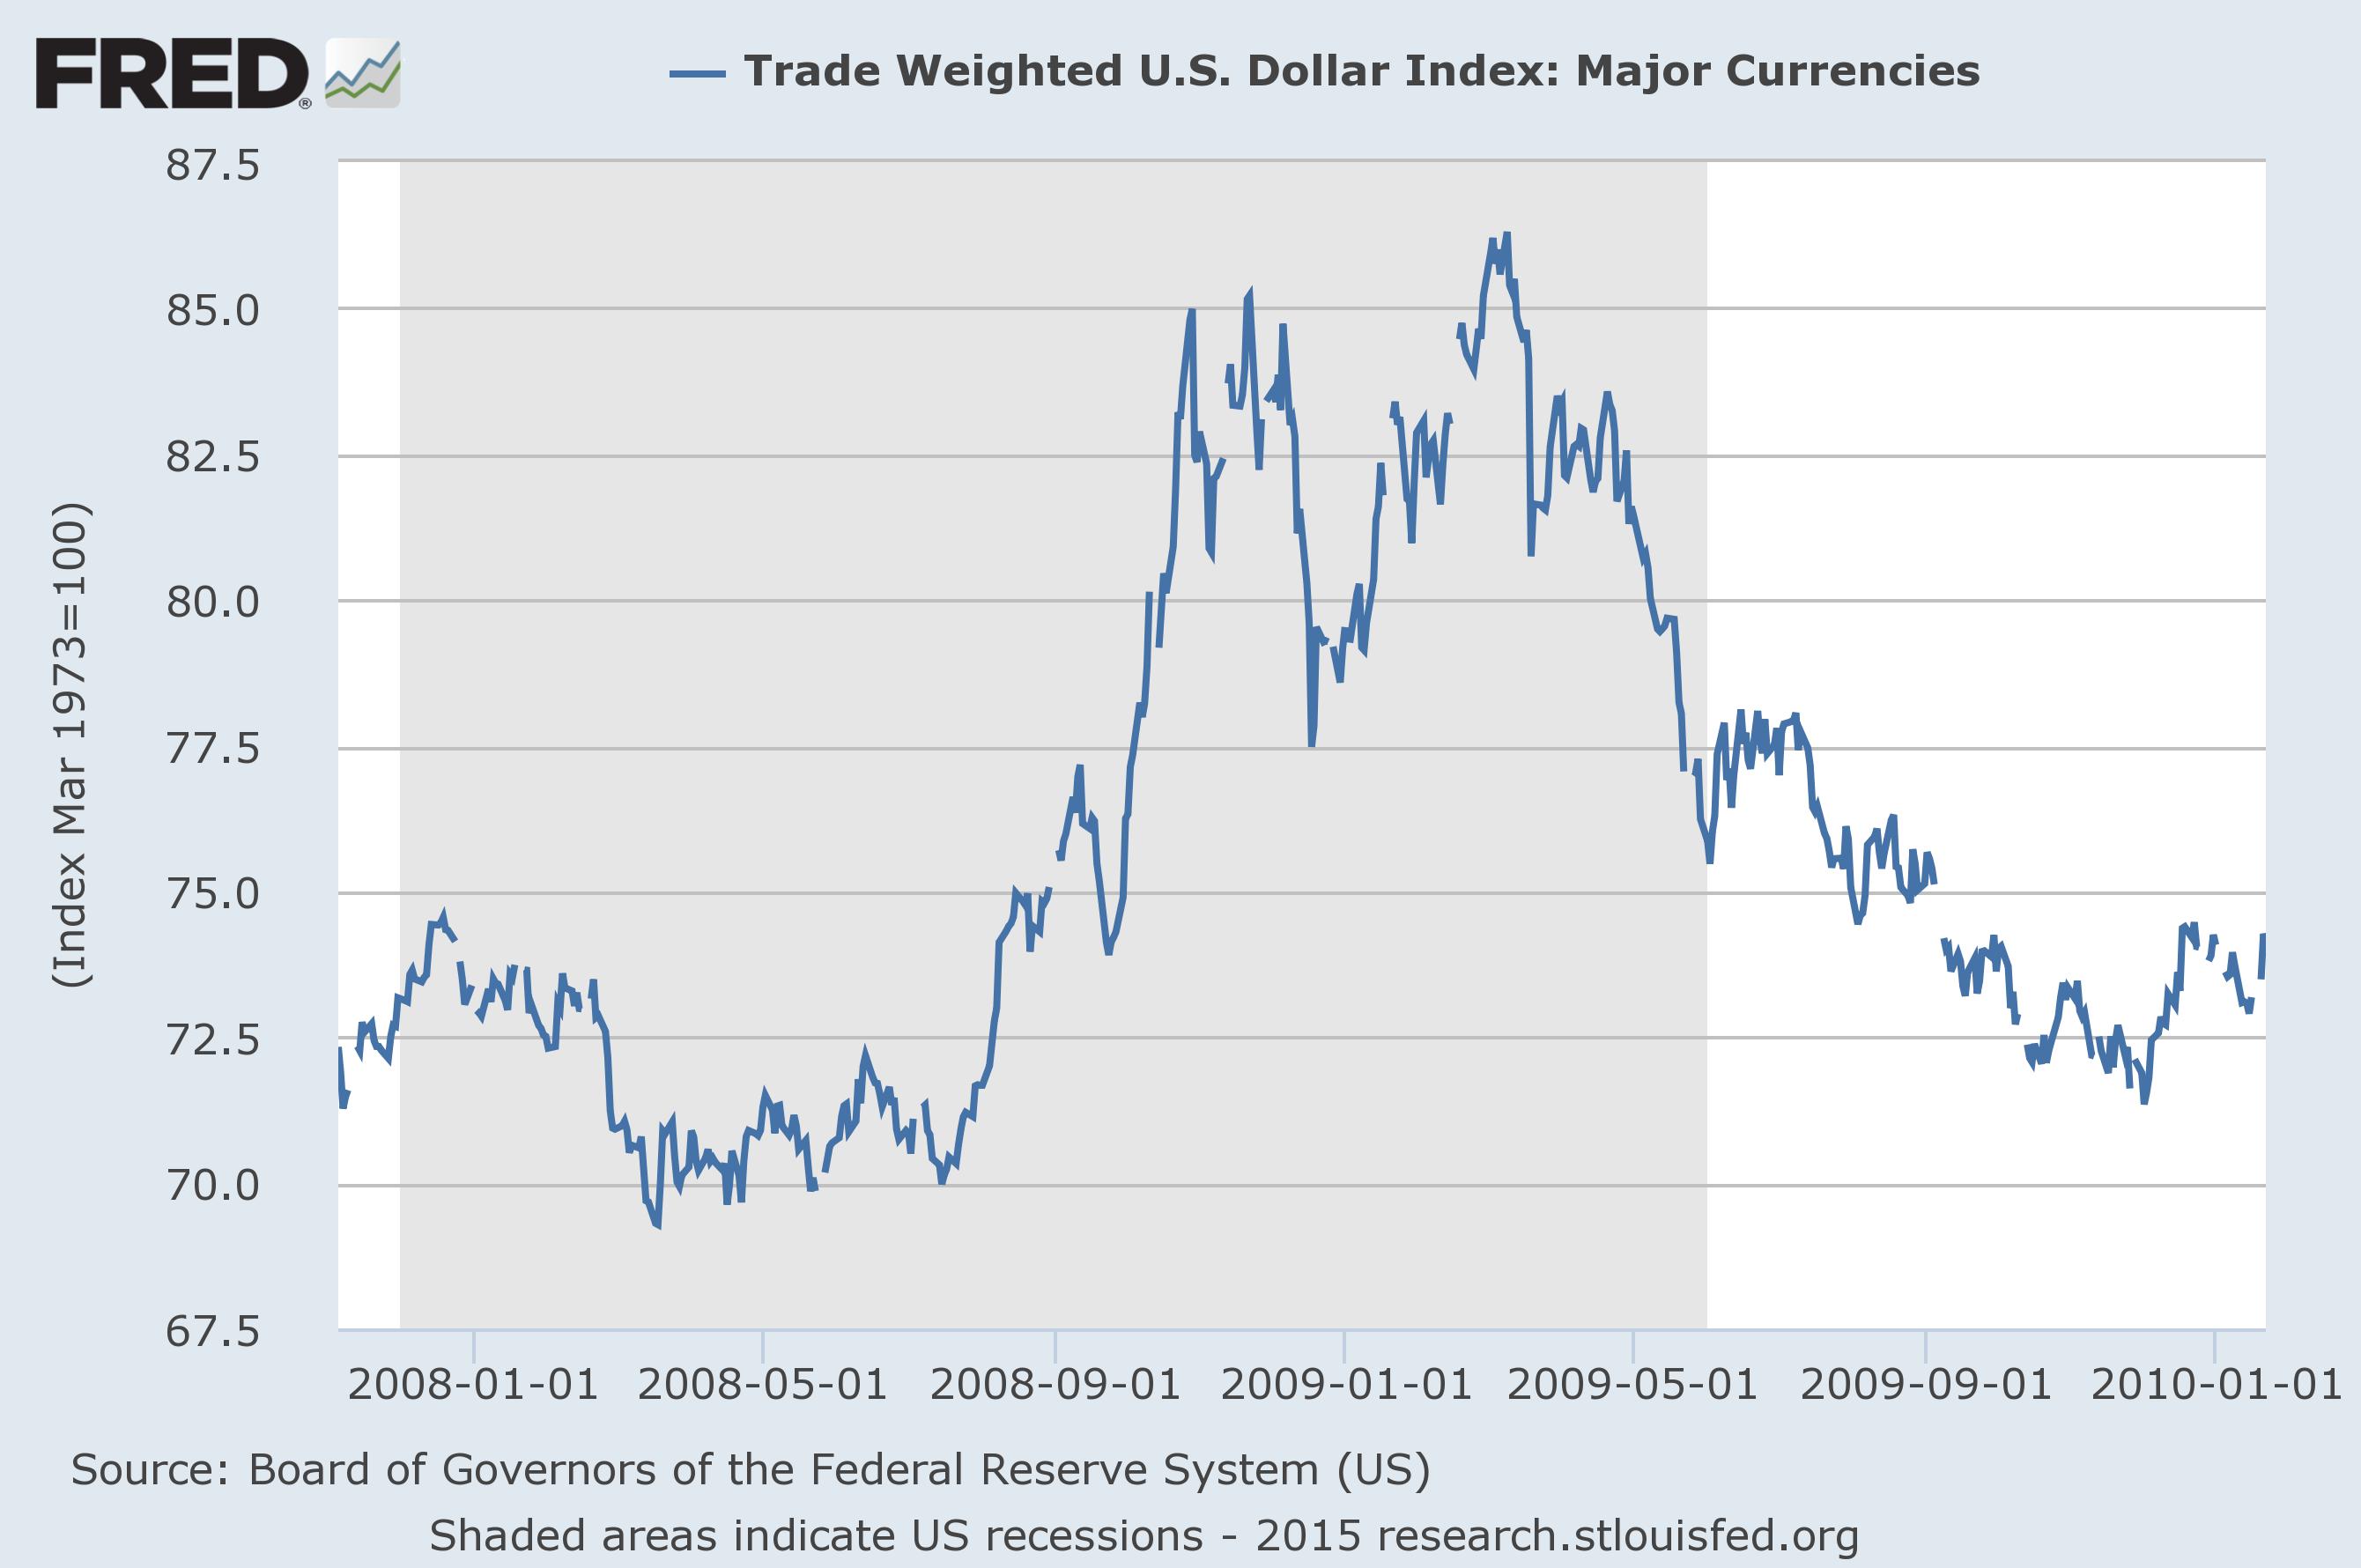
Source: Federal Reserve Board via FRED.
Now let’s consider trough to peak, and peak to trough, changes. From July 15, 2008 to March 9, 2009, the dollar appreciated 23.34%, using the formula (Q2-Q1)/Q1. From March 9 to December 2, 2009, the dollar depreciated 17.10%, using (Q3-Q2)/Q2. Dollar up by 23.34%, down by 17.10% — one might think the dollar was up overall by 6.24%. But in fact, using the base period formula (Q3-Q1)/Q1, the dollar is up by 2.24%.
One advantage of using changes in log terms is that additivity is retained, as Jim mentioned in an earlier post; using a log approximation of log(Q2/Q1), one finds the appreciation is 20.98%, the depreciation is 18.76%, the net change is 2.22%. And this is exactly what one gets looking directly at the log change from July 15, 2008 to December 2, 2009.
Second, a more recent, and stark, example is the Chinese stock market (discussed here and by Jeff Frankel). From July 11, 2014 to June 12, 2015, the Shanghai and Shenzhen CSI 300 index rises by 148.33% (using the base period formula), and then falls 28.21% by August 3 (2148 to 5334 to 3829). The August 3 value is 78.27% above the July 11, 2014 value (and not 120.12% that a simple adding and subtracting would have given you). And this all happens in the space of 13 months…
Third, for those of us who work in international finance, there is yet another reason use logs. Consider the dollar/euro exchange rate; there are two equally valid ways of quoting the rate — the number of dollars per euro, and the number of euros per dollar. If one express S as USD/EUR, and calculated the annual percent change using the base period formula, one would find that one would not get the negative of the annual percent change of 1/S in units of EUR/USD. (One would, if the depreciation rates were calculated using log differences.) To make this more concrete, from the US perspective, dollar has appreciated 19.1% from June 2014 to July 2015, while from the Euro area perspective the euro has depreciated by 23.6%.
See also Jim’s post on the use of logs.
The next post on logs will address whether to estimate a cointegrating relationship in levels of consumption and disposable income, or whether it is more advisable to do so in log-levels.
Here we go again. Menzie’s ego/feelings are bruised & now he seeks to call-out his readers and act condescending with lesson #136 of how to be on your worst sophomoric behavior.
wawawa aka rtd: Welcome back. Thank you for your advice; please go back to some even-handed and very mature insistence that my “…tenure might should be the first to be reconsidered in Wisconsin” along with asserting that employment virtually always rises after a recession. More laughs are needed.
But if you happen to have something substantive, that might be a nice contribution to the discussion.
Menzie, what in the world is this? I wasn’t thinking you were still so infatuated with me…….. I suppose that I’m flattered, but please leave me out of your online pissing matches.
a) my “even-handed and very mature” comment was only in reply to your continual childishness.
b) I still assert the same. It’s unfortunate that you choose to play petty games of semantics and gotcha and constantly ignoring proper context(s). As is always necessary with you, proper context is needed:
“As you’re aware, my comment was based on a number of previously mentioned factors. Specifically that the two administrations that you were comparing each began in vastly different periods intra-business cycle in addition to differences in severity of downturn and monetary policies, among others. It’s also worth noting that with regards to employment growth trending upwards after recessions, I never once said anything about duration to trend. Moreover, and given this proper context, the subsequent graphs you’ve posted (also note the graph I linked to in the comment you’re referencing displayed the entire time series through the recent recession/recovery and didn’t cherry pick) don’t dispute my claim, that is unless you’re Presidents Harrison, Garfield, or Zachary Taylor – with a (current) maximum of 22 months from NBER trough to employment trough, my ‘characterization would be apt’ (as shown below).
Again, just for proper reference for those who weren’t following the blog post with my initial comment, here is my initial comment in its entirety:
“menzie, I can’t help but feel you are taking advantage of (some of) your readers with (constant) partisan posts such as this. Wether[sic] it is intentional or not, the ‘ceteris paribus’ implication in such graphs are misleading at worst and disingenuous at best. Someone with your credentials should know better than to compare job growth between theses two (or possibly any) administrations, unless there is an agenda. With one beginning near the trough of one of the worst economic downturns in modern history, it was virtually guaranteed an upward trend with the other administration experiencing the exact opposite – implying causation or relevance (to anything other than dogma) is absurd. On the other hand, maybe your implication is that central banks don’t matter at all.”
In any case, I think you proved wawawa’s point well.
Human apes experience “reality” in linear time.
Human ape population grows (since the 18th century) at an exponential, and since the 1940s-50s at a bubbly super-exponential, log-periodic, rate.
Nature (matter and energy’s net energy per capita), including human apes on a finite, spherical planet, constrains human apes’ desires at a log-linear limit bound per capita.
Net energy per capita.
Exergy.
Entropy.
Debt to wages and GDP.
We human apes, young children as a species, are now encountering the log-linear limit bound of net energy/exergetic capacity of our finite, spherical, warm, wet rock orbiting an insignificant star far, far away from the center of the known (and unknown) universe/multi-verses.
https://www.youtube.com/watch?v=PeFfiN-htZg
http://www.azlyrics.com/lyrics/rush/2112.html
The “priests of the Temples of Syrinx . . .
Our great computers fill the hallowed walls . . .,
All the gifts of life are held within our walls . . . ”
“Attention all planets of the Solar Federation . . .
We have assumed control . . .
We have assumed control . . .
We have assumed control . . . ”
And the meek shall inherit (become the stardust of) the Earth . . .
Do the differentiated linear, log-linear, and log-periodic rates . . . and a Zen “no-thing” is happening WRT the planet’s net energy capacity per capita; but most of us don’t “know” it because the existing hierarchical system of prohibitively costly upward distribution of resource, income, wealth, influence, and power to the top 0.001-1% depends on the bottom 90-99% not “knowing”.
https://www.youtube.com/watch?v=hUYzQaCCt2o
This is all the more reason for the top 0.001-1% rentier Power Elite and rentier banksters to devise novel ways to encourage the bottom 90-99% to become, and remain, “comfortably numb”; and short of that, to keep them/us distracted, and if necessary, financially, economically, and politically comproimised and marginalized to the point of being easily assuaged or . . . “neutralized”.
Good post. I tell my students that suppose their stockbroker calls and tells them that he has good and bad news: “On the downside, your portfolio declined 10% last Friday, but on the upside it went up by 10% on Monday again”: Is this good or bad news on net? Depends on if he’s using logs …
Presentation using logs are an acquired taste. I think they can be very handy, but most readers aren’t comfortable with them. It’s like the metric system in the US: unquestionably superior, but running against accepted social conventions.
But this is Econbrowser, not the highway speed limit. We can stretch ourselves a bit to use a little more sophisticated analytical approach.
Menzie is right: it’s not falling in love with logs, it’s that log(data) is appropriate when the relationship between variables is multiplicative. The log function translates this into an additive relationship, which human beings have an easier time with (it’s visually simpler and mentally simpler). Statisticians and analysts do this all the time when looking at data–it’s just not a big deal in the analytic world.
It’s always useful to look at log values and then decide if that’s the best approach or if it makes more sense, with this data, to use either percentage (multiplicative) changes or some other measure (like a relative comparison using another measure). Always useful. An issue for readers – that is, those readers who aren’t reading comprehension and/or open-minded challenged – is that sometimes logs are used and you’re left wondering whether that’s the best approach because the logic isn’t explained.
Professor Chinn,
When you post your cointegration model for consumption and personal income, would you consider posting you EViews file so some of us could follow your steps?
Thanks for the consideration.
“your” EViews file would also be nice.
Far and away, Zero Hedge is the best blog on the web at covering the broad economy including the markets. The markets are integral in a way most academics don’t fully grasp. Also, ZH provides an unparalleled range of insights on the cultural-political-social sphere that supplement news about the economy and markets. This is not to put down Econbrowser, which has the resources of only two posters and a more narrow subject matter, including bringing to our attention some of the very latest in academic research. It is to say that some commenters here are clueless about the value of ZH. And it offers the opportunity to suggest that an excellent feature ZH has that Econbrowser doesn’t is its vote rating for posts on a scale from 1 to 5. The compleat economist who wants to fully grasp the workings of the real economy in real time ought to (indeed must) have a foot planted in all areas. A foot planted in only in the mainstream is foot short. And ratings are a time saver helping readers economically, in terms of their most valuable resource, pick and choose.
There are two things (of many) most readers here do not grasp. These rank amongst the primary failings of mainstream economics. One, not taking a comprehensive overview. I will cite just one example: utter lack of understanding of the financial side of the economy (including leverage, etc.) which resulted in at most 5% of practicing economists seeing the potential for serious crisis in 2008-9 in advance. Second, the wrongheaded focus on averages. That is, not understanding that many important aspects of an evolving economy come and then go. So context is vital. There was a step-function change in the economy as of this last crisis. Not everything works the same today as it did pre-crisis. This causes economists to scratch their heads and torture the data with statistical methods to come to an understanding of what the newest data is showing. Which of course must be interpreted. Which interpretation then, often as not, turns out to be wrong.
The 2008 crisis is just one of many nodal points, another being pre and post August 1971 when the currency went pure fiat. The primary tool of economic researchers is regression analysis. Regression is a form of averaging. It effectively homogenizes all observations and thus strips the analysis of context. This is fine and dandy if the structure of the economy is basically stable over the pertinent timeframe. Most assuredly, however, this is not the case for observations pre-2008 when intermixed with observations since. Even limiting our sample to data in the period since the recovery began is subject to this. Pre-September 2013 (give or take) was the QE era. Since then key markets have entered a post-QE era. Even using a dummy variable of zeros and ones would be an advance. This I rarely see in academic papers posted or linked to here.
A hands-on example of better understanding from this kind of thinking is: the stock market more likely than not entered a bear market as of the May 19th top in the Dow. The perspicacious forecaster who sees this then adjusts GDP forecasts downward. And reevaluates prospects for Fed tightening accordingly.
Few commenters here take the broad perspective. Many think they have a broad perspective but in reality do not. BC and various Anonymous’s are notable exceptions. I’d be interested to know how they first came upon this invaluable trait and then made it a part of their working repertoire.
Dave Giles (econometrican at U. of Victoria) has a series of posts on the interpretation pitfalls of log-linear models. More nuanced/technical than the exploratory statistics above but may tie in to your next post on estimating cointegration. Some are a bit tongue in cheek.
http://davegiles.blogspot.ca/2012/04/is-it-me-or-them.html
http://davegiles.blogspot.com/2012/05/log-transformations-forecasting.html
http://davegiles.blogspot.com/2013/08/forecasting-from-log-linear-regressions.html
http://davegiles.blogspot.com/2014/12/s.html
tdaula: Thanks! Excellent pieces. The first anticipates my next post on consumption and income; the others (particularly prediction using a log-linear model) I had already bookmarked or assigned to my students.