Has nonresidential fixed investment risen faster than GDP since the dot.com peak?
This is a follow up to this and this. If one wanted to answer the question of whether the share of expenditures devoted to nonresidential fixed investment was rising or declining, one could divide nominal investment expenditures by nominal GDP.
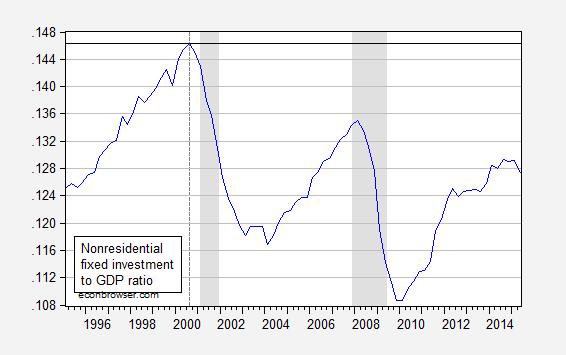
Figure 1: Ratio of nominal nonresidential fixed investment to nominal GDP, SAAR. NBER defined recession dates shaded gray. Source: BEA 2015Q2 advance release, NBER and author’s calculations.
It seems like the answer to the question posed in the subtitle is “no”, and in fact the share is about 2 percentage points lower at the recent (local) peak than in 2000Q3. But suppose one wanted to know if the quantity of nonresidential fixed investment was rising faster than quantity of output. In the old days (with fixed weight deflators), one could divide one “real” value by another, and look at the ratio. But with the advent of Chain weighted quantity indices, one cannot legitimately do that because of the non-additivity of these measures. But what one could do is to log the ratio and compare to the ratio in a base period. Suppose one wanted to compare Z against W relative to 2000Q3, then one could calculate the difference in cumulative growth rates:
log(Zt/Z2000Q3) – log(Wt/W2000Q3) = log(Zt/Wt) – [log(Z2000Q3/W2000Q3)]
The right hand side of the expression is the log ratio of Z/W, minus a constant pertaining to the base period, in the [square brackets]. Figure 2 depicts this series.
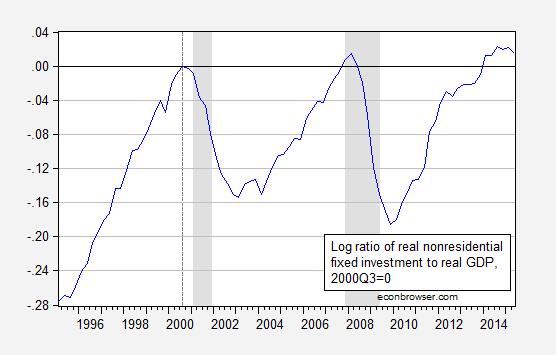
Figure 2: Log ratio of real nonresidential fixed investment to real GDP (in Ch.2009$), normalized to 2000Q3=0. NBER defined recession dates shaded gray. Source: BEA 2015Q2 advance release, NBER and author’s calculations.
The 2015Q2 value is 0.015, which means that the cumulative growth differential of nonresidential fixed investment relative to GDP since 2000Q3 is 1.5%; that is, investment has increased (slightly). Interestingly, this graph conveys a drastically different story than that conveyed by Figure 1 (particularly if one does not think very deeply about the units of measurement). This (log) depiction also has the advantage that a constant slope indicates a constant percentage growth rate.
More on chain weighted indices here. The data plotted above pertain to gross investment; for a discussion of net investment trends, see this post.
Menzie, will “To Log or Not to Log, Part IV”, or any edition, reference your disingenuous & partisan climate/weather analyses?
rtd: I don’t believe logs are relevant to referencing the meanderings of denialists. But I might change my mind. I think first would come a further explication of how employment does or does not rise after every recession around the world.
Right. So wouldn’t that make using logs reasonable in your climate posts? After all, they have been known to be disingenuous.
So, are you saying that you’re going to do a post on employment rising/falling for every recession around the world? Sounds like quite the ambitious dataset. Weird, but interesting. Is your null zero employment growth? It’d be an interesting endeavor if you could do such an analysis objectively and reasonably. Not to mention if you actually kept subsequent discussions on topic, complete, and genuine.
rtd: You characterized them as disingenuous. I don’t recall the masses joining you in righteous indignation.
Yes I did. Considering your fondness of bias behavior, don’t fall prey to the biasing your thoughts in favor of believing absence of evidence is evidence of absence. Else, you could explain how explicitly pointing out a single year’s record warmth (“Hottest on Record
Global temperatures in 2014, that is.”) is evidence of global warming. Oh, maybe you were expecting people to use additional provided context to your comment? What a silly, silly concept!
rtd: Thank you for your typically well-reasoned and substantive comment.
Of course, there’s always the chance you were making a casual observation on the year’s weather with no implication in climate change……. And I shouldn’t make assumptions.
In your defense, I will say the post on chain weighted indices is a good one. Of course, as expected from you, a very strange intro, but important points throughout.
Isn’t the difference just down to nonresidential investmrnt prices relatively declining, and can’t you show that without logs, eg by plotting rgdp indexes normalized to 100 at some date?