More states are slowing even as the Nation continues to expand. The states that contracted include Wisconsin and Kansas, states pursuing a contractionary fiscal policy. Wisconsin’s level of activity lags that predicted by historical correlations.
The Geographic Dispersion of Growth. A diffusion index measures the proportion of individual entities expanding or contracting; a reading greater than 0 indicates a majority (of states, in this case) are expanding.
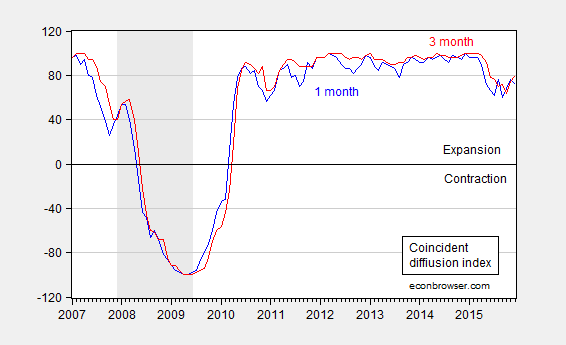
Figure 1: One month diffusion index (blue), and three month diffusion index (red). NBER defined recession dates shaded gray. Source: Philadelphia Fed, NBER.
Faster Growing States, Slower Growing States. A large majority of states are still expanding. This is manifested in a still-rising national coincident index.
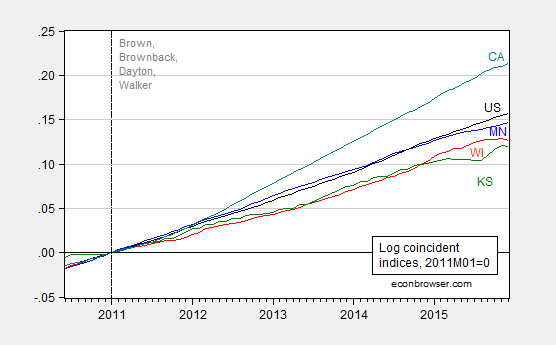
Figure 2: Log coincident indices for Minnesota (blue), Wisconsin (red), Kansas (green), California (teal), US (black), all normalized to 2011M01=0. NBER defined recession dates shaded gray. Source: Philadelphia Fed, NBER, author’s calculations.
One of the few (non-energy dependent) states declining on a three month basis (see map) is Wisconsin. Fortunately, Kansas’s poor performance casts in a favorable light Wisconsin’s otherwise lackluster performance.
How Badly Is Wisconsin Lagging? While Wisconsin economic activity is declining, it might be the case that this is because national economic activity is decelerating, and Wisconsin follows the Nation. This hypothesis can be assessed by measuring the historical correlation between Wisconsin and the US up to 2009M06 using an error correction model, and then conducting out-of-sample forecasts (an ex post historical simulation). The forecast plus 90% forecast interval is shown in Figure 3. The methodology is laid out in this post (except a 2 lag specification is used, and is estimated over a sample starting in 1990).
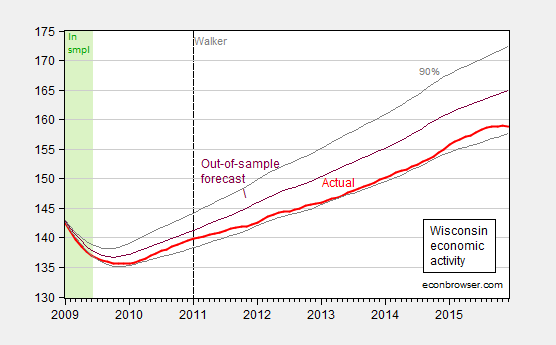
Figure 3: Wisconsin coincident index (bold red), and dynamic out-of-sample forecast (purple), and 90% band (gray lines). Green denotes in-sample period. Source: Philadelphia Fed, NBER, author’s calculations.
The counterfactual takes account of the fact that Wisconsin economic activity has over the long term (1990-2009M06) lagged US economic activity; that is, a one percent increase in national economic activity is associated with a 0.73 percent increase in Wisconsin. For more details on inferring long run relations from error correction models, see here.
I have not assumed weak exogeneity of US economic activity for Wisconsin. Doing so — which seems plausible –yields the following figure.
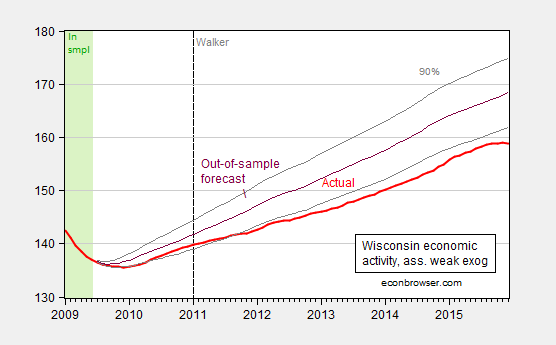
Figure 4: Wisconsin coincident index (bold red), and dynamic out-of-sample forecast (purple), and 90% band (gray lines). Green denotes in-sample period. Assumes US economic activity is weakly exogenous with respect to Wisconsin. Source: Philadelphia Fed, NBER, author’s calculations.
In other words, Wisconsin is, with statistical significance, underperforming what would have been expected from historical experience. One argument is that Wisconsin’s statistical underperformance, which has intensified in recent months, is due to the dollar’s recent strength. This is a plausible interpretation for the last year [1]; however it fails to explain why underperformance was in evidence during the prior period of dollar weakness.
Fortunately for Wisconsin residents, our Governor Walker has assured us that The state of our state is strong!.
Prof. Chinn,
How much faith do you place in the Coincident Index? I track this for my state and the series (as well as the Leading Index) changes every month out of the previous year with every additional update by the Philly Fed. (The December update changed every month back to at least February.) My state saw a decrease in the Coincident Index in December for the first time since July, 2009– a remarkable event for which I can find no other indicators to support. The only thing I can think of is that the unemployment rate increased. But the labor force increased with it (bucking a long downward trend) as did overall employment; so, more people entering the workforce looking for jobs seems to have driven the rate up. Incomes were up, as were tax receipts to the state, housing permits, etc. Do you consider it a reliable indicator?
JT: If you look at the documentation for the construction for the coincident indices, you’ll see the indices are based on labor market indicators and real wage and salary disbursements. As the labor market indicators get revised, it’s natural for the coincident indicators to be revised. So I have as much faith in the coincident indicators as in the labor market indicators.
Real quarterly GDP for Wisconsin is cointegrated with the coincident index (both in logs), so I place some faith in the indicators as pointing in the right direction (in levels).
The modern environment is pretty different from the past.
Look at high yield spreads – which have blown out to levels that have often triggered recessions in the past, and yet the FOMC is tightening policy:
http://tinyurl.com/hjrq6nv
In other news, oil inventories in the U.S. have begun climbing, again:
http://tinyurl.com/zvdghmx
Professor Chinn,
I see how to duplicate Figure 3. I am not certain about what it means to consider US economic activity as weakly exogenous and thus am not certain about how to duplicate Figure 4. Could you enlighten the ignorant. Thanks.
AS: Include a contemporaneous first difference of US index.
Thanks. That seems to do the trick. Still not certain about the meaning of “exogenous” related to the computation. Also, I notice that for my attempt the information criteria improved, but the “t” statistics changed for the worse for my D(Log(US(-1))) and D(Log(US(-2))). I am not certain of how to evaluate these changes in the model.
Professor Chinn,
Looking at the log series of both indicators, visually it looks like there are one or more structural breaks. Also, if one regresses Log(WI) as a dependent variable and Log(US) as the independent variable and include a constant, the residuals seem to have a unit root. Also, using the Johansen cointegration test, some of the categories show that there are two cointegrating equations, which is not possible. Any enlightenment would be appreciated.
In looking at the raw GDP data for the state and nation it appears the state is pretty even except 2004-2006 when it losses ground to the US. Segmenting these three periods would be interesting to see how that measures quantitatively.
From that it doesn’t appear there is a long trend of under performing the US.
Interestingly enough Illinois seems similar but under performs the US for an additional year or so both before and after Wisconsin’s soft period.
Long link but interesting data. Maybe regional weakness? Lots of mfg headed to China in this window?
https://research.stlouisfed.org/fred2/graph/?chart_type=line&recession_bars=on&log_scales=&bgcolor=%23e1e9f0&graph_bgcolor=%23ffffff&fo=Open+Sans&ts=12&tts=12&txtcolor=%23444444&show_legend=yes&show_axis_titles=yes&drp=0&cosd=1997-01-01%2C1997-01-01&coed=2014-01-01%2C2014-01-01&height=445&stacking=&range=Max&mode=fred&id=WINGSP%2CGDPA&transformation=lin%2C&nd=%2C&ost=-99999%2C&oet=99999%2C&lsv=%2C&lev=%2C&scale=left%2C&line_color=%234572a7%2C&line_style=solid%2C&lw=2%2C&mark_type=none&mw=2&mma=0%2C&fml=a%2C&fgst=lin%2C&fgsnd=2007-12-01%2C&fq=Annual%2C&fam=avg%2C&vintage_date=%2C&revision_date=%2C&width=670