Or, “Is current output really 18% below potential output?”
Matt Klein has defended the calculations in the Friedman study of the Sanders plan as “not extreme”. In particular he has used this graph to show that 5.3% sustained growth will only close the output gap toward the end of the projection period. (Note: I do not know what the output gap actually used in the Friedman study, as it is not reported.)
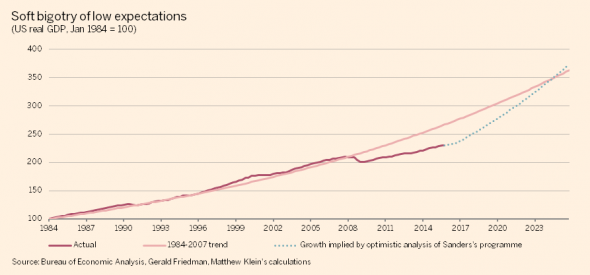
One thing that should be remembered is that the trend line extrapolated from 1984-2007 implies that the output gap as of 2015Q4 is … -18%. A graphical comparison which highlights the implausibility of the -18% output gap is shown below:
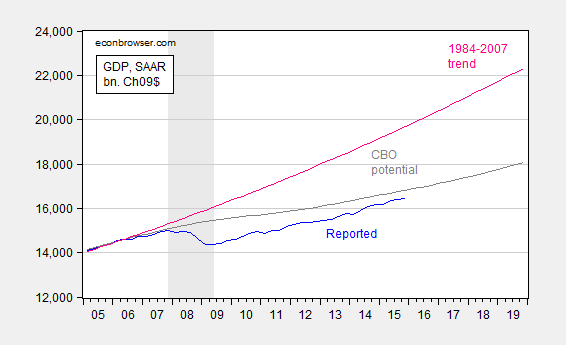
Figure 1: GDP (blue), potential GDP from CBO (gray), and exponential deterministic trend estimated from 1984-2007 (pink). NBER defined recession dates shaded gray. Source: BEA (2015Q4 advance), CBO Budget and Economic Outlook, 2016-26 data appendix, NBER and author’s calculations.
By way of comparison, the CBO’s estimate is -2.2% (both in log terms). OECD estimates 2015Q4 output gap at -1.9%. [1] The IMF in its Article IV consultation with the United States estimated a gap of -1.6 percentage points of potential GDP for 2015, -0.7 percentage points for 2016. [2] If indeed the output gap is 18 percentage points, most mainstream economists would expect to see substantially lower core inflation than what we have observed thus far.
One could argue that low headline price inflation suggests more slack than these estimates indicate. I have two observations: (1) the most recent report of higher core CPI inflation runs counter to the presumption of enormous slack, and (2) using a modified Ball-Mankiw approach and the lower inflation back in 2015Q3, and assuming completely anchored inflation expectations, the implied gap was much smaller in absolute value terms than 18%.
Another way to resurrect the proposition that the assumptions built into the projections are not extreme is to assert that the aggregate supply curve is very flat (see footnote 16 in Friedman (2016)).
Addendum, 2/20 7pm Pacific: I want to stress that estimating potential GDP and the output gap is a difficult task. For those interested in the details, read these posts: [3] [4] [5].
I’m not an economist but the fact is I don’t trust the wonkery of the anti-Friedman side in this debate. It seems overly political and not objective. JW Mason’s and Mike Konczal’s takes seems more objective:
http://jwmason.org/slackwire/can-sanders-do-it/
http://rooseveltinstitute.org/praise-wonk-and-wonk-analysis-cea-and-sanderss-proposal/
As Mason points out:
“Ten years ago, the CBO expected GDP to be $20.5 trillion (correcting for inflation) as of the end of 2015. Today, it is $18.1, trillion, or about 12 percent lower. Similarly, the employment-population ratio fell by 5 points during the recession (from 63.4 to 58.4 percent) and has risen by only one point during the past six years of recovery. ”
How could the CBO be that far off? Krugman and others admitted their surprise that deflation did not take hold during the recovery, that inflation stayed low but positive. If the CBO was that far off, using their models and assumptions from 10 years ago you’d expect 12 percent lower GDP 10 years on would mean massive deflation.
The calculations of the output gap could be off as could be the function used to calculate it. It’s likely that pushing past the “output gap” and running above target inflation will raise potential GDP and not cause runaway inflation.
“If indeed the output gap is 18 percentage points, most mainstream economists would expect to see substantially lower core inflation than what we have observed thus far.”
As I’ve said, Krugman and others admitted surprise to how inflation was keeping up during the recovery.
Peter K.: Running output above potential (what we used to call a “high pressure” economy) could raise potential (higher investment in physical and human capital). But we have to use sensible parameter estimates.
As I said, a very flat aggregate supply curve is consistent with Friedman’s projections.
We rely upon historical correlations and theory to determine the effects of policies. I don’t know how else to make inferences. In that regard, even using assumptions favorable to finding a big output gap (well anchored expectations), I can only get an output gap as large as 7%.
“we have to use sensible parameter estimates”. Exactly. The issue with Gerald Friedman’s paper is it failed to model any of this out. It just ran simulations with no grounding in anything resembling a production function. To say so is neither political nor an attack on anything Bernie Sanders has proposed.
Alas, this political campaign has become overly heated that some people cannot separate the analysis from the politics. You have. But alas there will be those that think otherwise. My advice? Ignore them and keep up the excellent work
“…A graphical comparison which highlights the implausibility of the -18% output gap is shown below…”
I wonder , had you been advising FDR in 1935 , and assuming away the upcoming buildup for WWII , would you have been similarly cautious ? That period seems to me a fitting analogy to today in many ways. This graph shows log real per capita gdp with a long-term trend line ( red , dashed ) , as well as two trend lines ( for 1935 and today ) for 4.5% per-capita growth ( black , dashed ) as per Friedman’s analysis ( via Krugman ) :
https://research.stlouisfed.org/fred2/graph/?g=3wlj
In the absence of the war preparations , a Friedman-type analysis and associated advice to FDR might have suggested pushing hard along the 4.5% growth path until 1952 or so , with , in retrospect , good justification. So today , with a similar deviation between current output and trend , and similar prospects for structural improvements ( mainly via correction of extreme inequalities and their associated demand and productivity impacts ) , is the same justification dismissed out of hand ?
Marko: In 1938, the GDP deflator inflation rate was 6.8 percentage points lower than it was in 1937 (that is, it was -2.8%). This indicated a big negative output gap, and would have merited in my mind aggressively expansionary macro policies.
” ….In 1938, the GDP deflator ………..indicated a big negative output gap, and would have merited in my mind aggressively expansionary macro policies. ”
That’s interesting , but I asked about 1935 , not 1938.. The deflator was up by 5.5% in 1934 , 2.05% in ’35 , 1.2% in ’36 , and 4.3% in ’37. I’m assuming , then , that only the decrease from ’37-’38 would have spurred your expansionary advice. Again , in retrospect , knowing where the economy ended up in the ’50s and ’60s , anything but aggressive expansion throughout the ’30s and ’40s – at the least maintaining the 4.5% per cap growth path – would have been a mistake.
Similarly , using the deflator as a guide , the U.S. may be “turning Japanese” , with a lag of ~15 years , soon to descend into chronic mild deflation. Not the outcome I’d prefer.
BTW , , the deflator data makes it appear that Japan was out of the woods in 2014. Hmm , I don’t know about that.
I do think your concluding statement – ” estimating potential GDP and the output gap is a difficult task ” – is spot on.
https://research.stlouisfed.org/fred2/graph/?g=3wIf
Marko: Apologies. In 1935, the GDP deflator inflation rate was 3.2 percentage points lower than it was in 1934 (that is, it was 2.0%). This indicated a substantial negative output gap, and would have merited in my mind expansionary macro policies.
The 25-54 Emp/Pop ratio is currently at about 77.5%, while it was at 81.5% in the late 1990s. If that
late ’90s figure to be “full employment”, then that would imply employement could be 5% higher
than it is today. Depending on how much additional hours per employee might accompany
such an increase in total employment, and depending on how much, if any, productivity increase
might accomany such growth, I think the output gap is below 10%, but certainly much more than 2%.
Sorry but the 25-54 EPOP was Boomer driven then. Why do you think it surged the most the 80’s? Your figures are wrong. The output gap is about -1-1.5%. The wage surge of the 4th quarter(which was muted by a earlier readjustments in the 2nd and 3rd quarter and continued in January) suggest the gap is nearing closure.
For comparison:
https://econbrowser.com/archives/2015/02/jeb-bush-on-the-desired-trend-in-real-gdp
There seems to be a lot of (potentially) productive labor unemployed, underemployed, or underutilized.
And, a lot of capital that can be put to more productive uses.
Consequently, the permanent destruction of potential output, through changing demographics, is taking place slower than some people believe.
Maybe, but all cycles could say this. I think a bunch of productive labor is already being put to use. Maybe, not in the way you would like, but it is. Trying to create ‘gaps’ is intellectually dishonest and ignorant.
Are you saying the huge output gap over the past seven years is intellectually dishonest and ignorant?
Why are there so many Americans with college degrees working at low-paying jobs. And, why are there so much idle labor and capital?
I think, the vast majority of college grads have the capacity to easily and quickly learn higher level jobs, including using capital equipment, to be more productive..
Therefore, potential output can be raised substantially.
The largest possible gains in labor participation are in the Latino and African-American population. However in order for them to fully participate in the labor force significant investments will be necessary to offset the decades of poor quality education and in some cases significant rehabilitation for those re entering the job market after time in prison.