Do shocks to agriculture and aircraft really explain Kansas’s dismal economic performance? If only one looked at Kansas GDP, would Kansas look just terrific?
Political Calculations takes me to task, claiming my analyses of the Kansas economy equate to “junk science.” In particular, he argues that the use of the Philadelphia Fed’s coincident indices provides a misleading picture of economic activity in Kansas. This argument is just one more instance of either incompetence (see here and here) or sheer mendacity (see here).
The Critique of the Economic Activity Proxy Variable
Ironman asserts that because Kansas has an agricultural sector, the coincident index for Kansas is does not well depict overall economic activity. Yet the graph that Ironman himself posts indicates that the correlation between the Philly Fed’s coincident index and GDP for Kansas is between 0.55 and 0.70. (He also has a fixation on the agriculture share, even though as of the last reported quarter, it only accounts for 5.8% of value added.)
He then argues that my assessment that Kansas’s economic performance is incorrect because the “wrong” measure is used. However, he fails to note the instances where I have used his preferred measure, state GDP, to arrive at the same conclusion: Kansas underperforms.
State GDP Tells the Same Story as the Coincident Index
Compare the results of two ex post historical simulations, comparing actual economic performance against predicted on the basis of historical correlations. The first is from an error correction model using coincident indices (quarterly averages of coincident indices, 1991Q1-2010Q4, 1 lag of first differences, assumes weak exogeneity of US economic activity, first difference of lagged drought variable included); the second is from June 23, 2016, using state GDP.
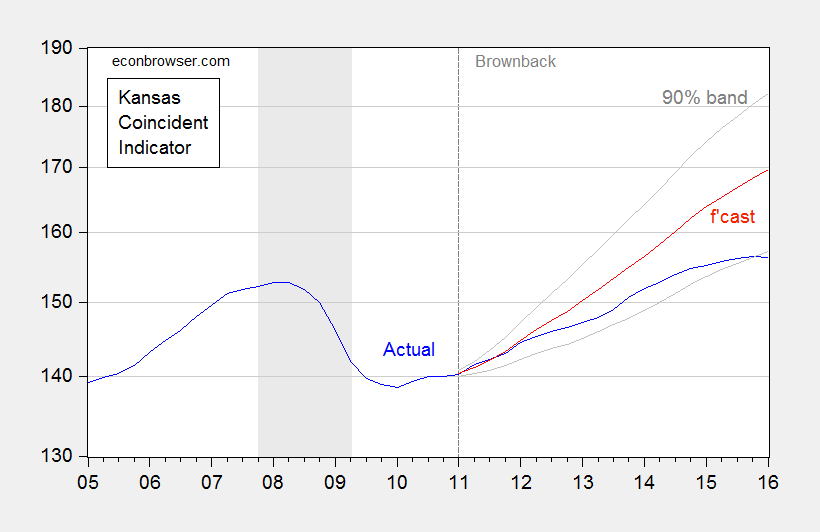
Figure 1: Coincident index for Kansas (blue), ECM forecast (red), and 90% confidence band (gray). For forecast, see text. Source: Philadelphia Fed (May releases) and author’s calculations.
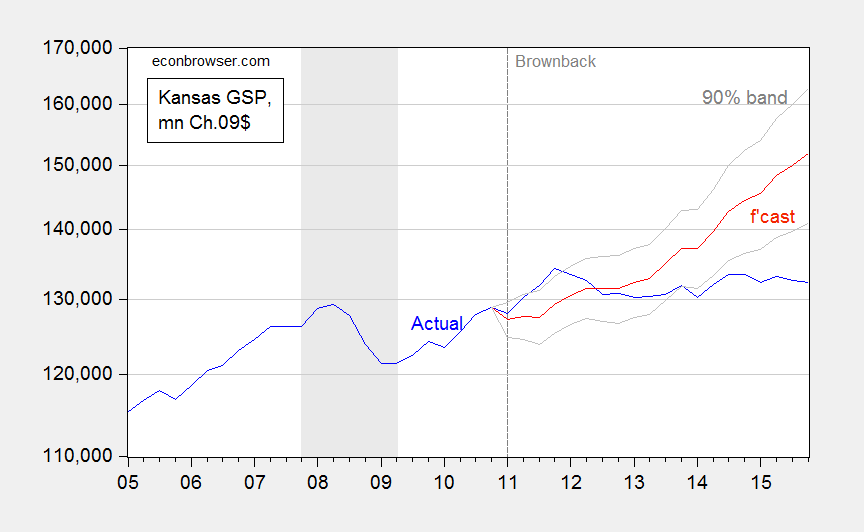
Figure 2: Kansas GDP, in millions Ch.2009$ SAAR (blue), ex post historical simulation (red), 90% prediction interval (gray lines). Forecast uses equation (1) in this post. NBER defined recession dates shaded gray. Log scale for vertical axis. Source: BEA, NBER, and author’s calculations.
In other words, even if one uses the GDP measure Ironman prefers, Kansas is still underperforming against a counterfactual. Indeed, the gap between the US and Kansas is larger using the GDP measure: 15.1% using GDP vs. 8.1% using coincident indices. So his criticism of the use of coincident indices is merely a means to distract the unwary reader.
Conclusion
- Using either state GDP or coincident indices, Kansas is doing poorly against her neighbors, and against a counterfactual based on historical correlations.
- Do not look for reasonable economic analysis from people who keep on asserting the same things after being shown the irrelevance of their criticisms, rely on nominal figures, infer an imminent massive GDP revision based on a misunderstanding of the nature of Chain weighted indices , and (in his MyGovCost incarnation) spin tales of a conspiracy asserting the US Government’s active destabilization of the world economy in order to lower borrowing costs.
Postscript: Ironman asserts that real Kansas GDP stripped of agriculture and manufacturing looks much better. Unfortunately, his graph in his post plots a series where he calculated Kansas GDP ex-agriculture and manufacturing by simply subtracting real agriculture and real manufacturing — both measured in Chain weighted dollars — from real GDP measured in Chain weighted dollars (the red line in Figure 3 below). This is, quite plainly, the wrong procedure, as I explained in this post.
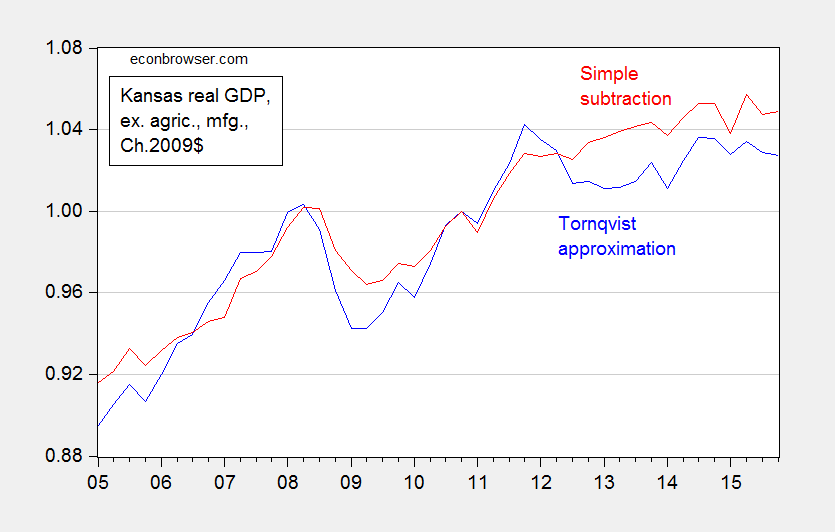
Figure 3: Kansas real GDP ex. agriculture and manufacturing, calculated using Törnqvist approximation (blue), and calculated using simple subtraction (red). Source: BEA and author’s calculations.
So a third conclusion: Don’t trust analyses from people who don’t understand the data they are working with.
I’m still thinking it’s demographics. Kansas and Missouri, for example, are wallowing a bit:
http://www.kansascity.com/news/business/article30614901.html
Comparing demographic changes, the economic performance seems to follow:
http://www.indexmundi.com/facts/united-states/quick-facts/compare/kansas.missouri
http://www.indexmundi.com/facts/united-states/quick-facts/compare/kansas.nebraska
http://www.jec.senate.gov/public/_cache/files/5f9c0b1b-dd09-4a4e-9079-2f49ff3e6fe9/jec-state-economic-snapshots-june-2016.pdf (see page 4)
Of course, population changes can be due to policies, mix of business, or other long term trends.
There is no doubt that the central U.S. is languishing. The reasons may not be as simple as they first seem.
So if you take your post and subtract Ironman’s post, you end up with …?
Jokumi: Kansas is doing poorly.
The real problem for those that can’t accept that Kansas is doing worse than the national average is that by their theory it should have already SKYROCKETED to the top.
Unfortunately the idea of rethinking their ideology and theories in the face of actual facts and performance is a completely alien notion.
Yes and on top of that they are defending a narrative not the truth. So whenever data stray away from their narrative they try to dismiss that data or those who present it. If actually have a little knowledge and a brain it should come as no surprise that in an economy that suffer from overcapacity and lack of demand – it is not going to be good for GDP to take money from the consumer class and give it to the investor class. These are very simple concepts and not beyond even a fifth grader who want to understand. But it is sort of fun to pull apart “experts” who desperately try to hold on to a sinking narrative.
Here’s what a senior economist at the Federal Reserve Bank of Kansas City said about Kansas:
“When asked by Rep. Marvin Kleeb about what he projected for the Kansas economy and what would draw young people to stay in the state, Brown said that while he didn’t have a 20- or 30-year forecast, he believes the rural out-migration will be a challenge not just for Kansas but many Midwestern states.
“I think increasingly what the literature kind of suggests is that people are looking for amenities,” Brown said. “They’re looking for places that they desire to live.”
“Differences in tax policies, the evidence doesn’t really bear that out,” he said. “It’s really about what amenities people are able to have in that area.””
PeakTrader: I concur that tax policies in and of themselves are probably secondary; however, tax policies (and revenue) are intimately tied up with the provision of public services (roads, education, infrastructure) that are the amenities that people value. With reductions in tax revenue come reductions in government spending.
Menzie Chinn, I don’t think it was tax rates that attracted high-skilled workers to Denver, Colorado (although it’s uncertain if some businesses got tax breaks), it was the growth of the Denver Tech Center and the low cost of living.
A lot of people from California moved to Colorado exchanging spectacular beaches for spectacular mountains. The weather in Colorado is much more seasonal.
It didn’t take long for much lower housing prices, compared to California, to rise substantially, in the ’90s and ’00s, even with the homebuilding boom.
There was tremendous spending on public works in the Denver Metro area in the ’90s and ’00s.
“I don’t think it was tax rates that attracted high-skilled workers to Denver, Colorado”
so you agree tax cuts are not the true path to prosperity?
No, a high-paying job and a low-cost of living for workers can be a better path to prosperity than tax cuts.
High taxes, for example, caused Tiger Woods to leave California. Did that make California more prosperous?
Political Calculations epistemology strikes me as weak.
As for PC’s post on The U.S. Military’s Local Economic Impact (June 30, 2016), the use of arbitrary ratios (jobs generated per active duty personnel) suggests that the blogger does not understand political rent seeking.
For most communities, a dollar spent is a dollar spent and a job is a job. Whether the jobs and generated local income come out of some fancy conceptual ratio or not is largely irrelevant excepting for political marketing purposes.
That’s right,I agree with you
The Keynesian statistics do in fact show a decline because the government spending portion of the statistics is down significantly. Kansas has also had to deal with the deflation created by the appreciating dollar so agriculture as with other commodity prices are down.
But Kansas has had record new business formations since the Brownback tax cuts were implemented. This is contrary to the nationwide trend of a loss of new business formation.
Then for May 2016 the unemployment rate in Kansas was a 3.7% compared to a national average of 5.5% and this in a state with significant declines in one of its primary businesses, agriculture.
Tax reform has also removed 388,000 with the lowest incomes from the tax rolls.
From 1995 through 2009 Kansas saw $263 million in income gains flow from Kansas to Missouri. In 2013 Kansas saw a reversal of this trend with $85 million flowing from Missouri to Kansas.
Kansas is strong contrary to Menzie’s masterful manipulation of data.