Reader Bruce Hall asserts the two states aren’t doing too badly in terms of unemployment rates.
Different measures tell different stories. Kansas is much closer to “full employment” than most states; Wisconsin isn’t doing badly either. It’s nice to see the rest of the story.
At this point, it’s useful to look over time, as opposed to across states. Figures 1 and 2 present the Kansas-US and Wisconsin-US unemployment rate differences, over time, and compared against average differences for the 1986-2010 period (“Great Moderation”).
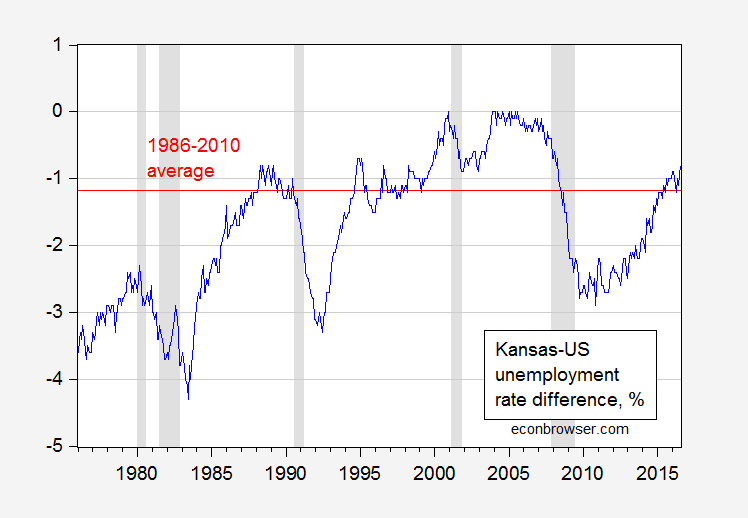
Figure 1: Kansas-US unemployment rate differential, in percentage points. Red line denotes average value over 1986-2010 period. NBER defined recession dates shaded gray. Source: BLS, NBER and author’s calculations.
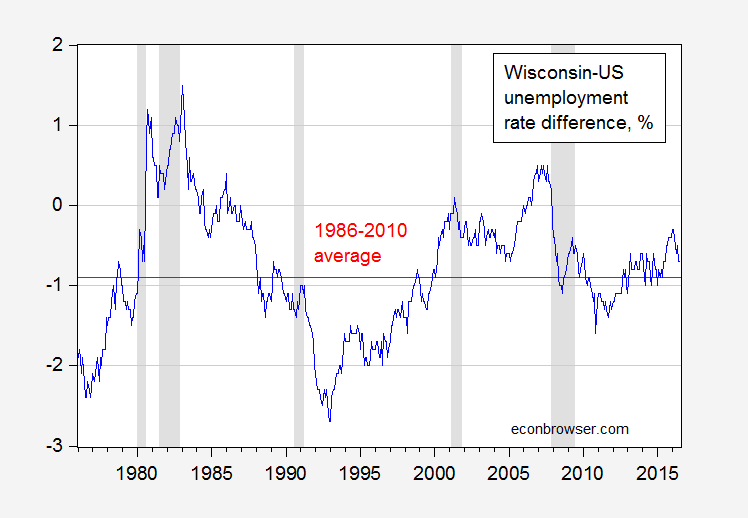
Figure 2: Wisconsin-US unemployment rate differential, in percentage points. Red line denotes average value over 1986-2010 period. NBER defined recession dates shaded gray. Source: BLS, NBER and author’s calculations.
In other words, in both states, the unemployment rate differential is now higher than their averages. In my view, that’s not so great…
Wow – interesting stats!
It appears that both Wisconsin and Kansas did quite poorly relative to their averages between 2002-08; was that also the fault of Brownback and Walker?
The “average” seems to incorporate quite a bit of dispersion which leads me to question how significant one or two-tenths is. What I see from these charts is that the U.S. is finally recovering back to its “historical relationship” with Kansas and Wisconsin not that Kansas and Wisconsin are failing.
Of course, if you only show a couple of years and expand the vertical scale significant, things can look bad for those states.
Bruce Hall: For Kansas, the 2 standard error band does not encompass -1.17 — so it is a statistically significant deviation.
Sigh. The value range for Kansas appears to be (visual inspection of the chart) -4.2 to 0 with a mean difference of about 1.1. The current value appears to be -0.9 or 0.2 higher than the mean… a relatively insignificant variation from the mean given the range of historical differences.
During the 2002-08 period, Kansas’ unemployment (U-3) rate was hovering around the same value as the U.S. total… meaning that it was underperforming versus the “historical average”. This was not Brownback’s fault since he was not governor. It may also have been a good indicator that the relationship between Kansas’ unemployment and the U.S. had shifted in the new millennium (do a trend line from 1975 to 2005). This change, I believe, is demographically driven, not policy driven.
As to the present 0.2 variance from the “historical average”… well, much ado about nothing. The real point which you seem to want to avoid is that it was the U.S. that lagged in employment performance versus Kansas after the last recession and that the current trend of the variances is only indicative of a return of the entire country to a more “normal” relationship to Kansas’ employment performance.
In other words, look to the rest of the country for policies that sucked and prevented the total U.S. from having higher employment rates. Kansas’ performance versus U.S. total is pretty consistent with the past 20 years (except for the 6 or 7 most recent years when Kansas’ performance was better.
Look for the meaning in the numbers, not the “statistical significance”. -1.17 is meaningless by itself. You know, forest… trees.
Talk about lowering the bar. We were promised that those governors had found the solution to get a dramatic increase in employment with their brilliant policies. Now we are supposed to be impressed that their harmonious underperformance has even worse in previous times. Isn’t it against the olympic rules to lower the bar to negative 1.
DeDude, I’m not sure if you are being sarcastic or dense.
For over four decades, the trend of the difference between Kansas’ unemployment rate and the U.S. total unemployment rate has been narrowing (on average Kansas’ unemployment rate is ~1.1-1.2 point lower than the U.S., but I’ve argued that the average obfuscates the trend).
The fact that the difference has been greater than the average for nearly all of the last economic recovery and now is less than the average can be interpreted in 2 ways:
1) Kansas’ economic performance versus the U.S. had deteriorated under Brownback (Dr. Chinn’s assertion) or
2) Kansas’ economic performance after the recession was far better than the U.S. and is returning to the “new normal” based on a trend of the differences since 1975 (my version).
I’d argue that the first interpretation is correct as far as it goes, but it misrepresents the changing dynamics between Kansas’ economy versus the U.S. in total since 1975 and that any average, which statistically interesting, is essentially meaningless.
Bruce Hall: I have put up a new post that has some observations on your hypothesis.
Wow. Look how bad the tenure of Jim Doyle was
Neil: Yes, although I’m not big on using unemployment rates as metrics, as I’ve mentioned before, given the relative imprecision (not big samples at the state level). Much prefer doing levels relative to counterfactuals — you could do the same thing I did, with whatever model you wanted, since the data exist.
Neil: Actually applied the same methodology I applied to Walker; Doyle outperforms counterfactual. See update to this post.