Bruce Hall says changing dynamics in Kansas have meant that a simple average difference (what I’ve called a individual state fixed effect) in Kansas-US unemployment rates is misleading — or more succinctly put, “the average obfuscates the trend”. So, I allowed a time trend and a square in time trend, in a regression over the 1976-2010 period (data series start in 1976; Brownback takes power in 2011). The t-stats on both coefficients are highly significant. Here is a picture of actual Kansas-US difference and the quadratic trend.
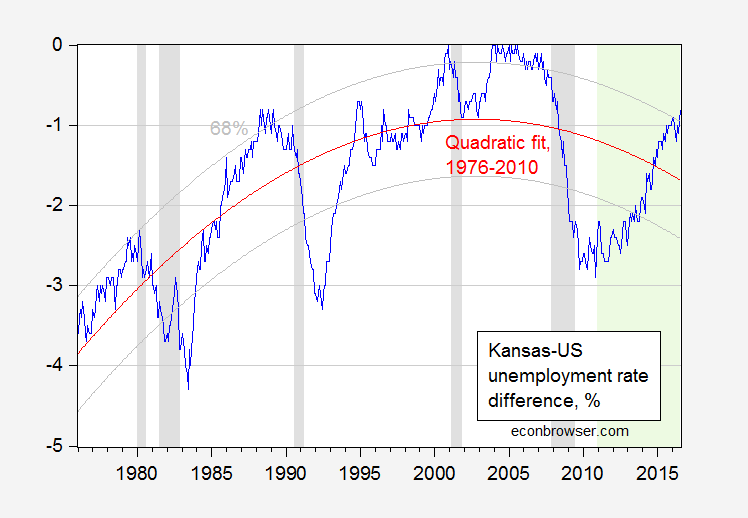
Figure 1: Kansas-US unemployment rate difference, in %, seasonally adjusted (blue), and quadratic fit (red), and 68% prediction interval (gray). NBER defined recession dates shaded gray. Out of sample period shaded green. Source: BLS, NBER, author’s calculations.
Kansas’s unemployment difference is 0.9 percentage points higher than “normal”, where normal is defined by historical correlations over the 1976-2010 period.
The regression is:
DIFF = -5.30 + 0.02time -0.00003time2
Adj-R2 = 0.59, SER = 0.71, nobs=420. bold denotes significance at the 5% level, using HAC robust standard errors.
In incorporating a quadratic in time trend, I am allowing for slow moving demographic changes to move the expected difference. One could add in a higher order polynomials in time — adding a cubic would increase the R2 statistic marginally, but would increase substantially (try it yourself!) the implied negative performance of Kansas relative to the US.
In any case, in evaluating performance, I’d say deviations from a level – as in Kansas employment relative to predicted, when long term trend movements are accounted for in a cointegration framework – is a better metric than a difference in a ratio from another ratio (which is what an unemployment rate is). Especially when at the state level the unemployment rate is very imprecisely measured.
I await the next re-interpretation of Kansas economic conditions with bated breath.
Update, 8/23 3PM Pacific: Here is the picture using quadratic fit over 1976-2016 period.
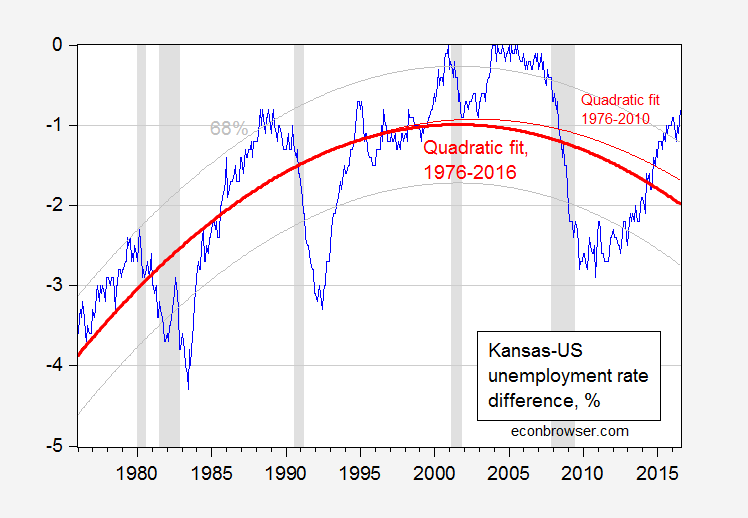
Figure 2: Kansas-US unemployment rate difference, in %, seasonally adjusted (blue), and quadratic fit over 1976-2016 (bold red), and 68% prediction interval (gray), and 1976-2010 period (thin red). NBER defined recession dates shaded gray. Out of sample period shaded green. Source: BLS, NBER, author’s calculations.
Menzie, quadratic fit? Stretching are we? You know full well that the end such “fits” are highly subject to change. A simple linear fit from 1975 will expose the dynamics. The “once in a lifetime” economic bust of 2008 highly distorts any relationship that developed over the past 40 or 50 years. It wasn’t Kansas that faltered as much as the U.S.
Look at the data up to 2008 and draw different conclusions about more normal economic cycles and relationships.
And, yes, I played those same games doing forecasting for Ford. It is a great tool when backfitting to changing or even cyclical relationships. Now, if you are proposing that, I agree. But the last few points are highly fluid on such an fitted line. If, for example, Kansas returns to a position of only a few tenths or zero less unemployment than the U.S., that curve moves quickly upward at the end while the early portions of the line won’t move much.
Tail wagging the dog much?
Bruce Hall: Let me get this straight – I should omit data because of the Great Recession dragged down the US too much? Wouldn’t that argue that keeping in the Great Recession overstates the linearity of the trend?
Anyway, an eyeballing of the data suggests a curvilinear, not linear, relationship. A Wald test on the quadratic coefficient yields an F-stat of 417, p-value of 0.0000. So I’m just supposed to say you have revealed truth in your vision that the relation should be linear. And if I’m worried about endpoint problems, isn’t the fact that I omitted 2011-16 helping deal with that endpoint problem?
Lo and behold, if I add in the 2011-16 data, the Kansas performance looks even worse than using just the 1976-2010 sample.
Hmm. So, if you add in 2011-16, Kansas’ performance looks really good. I don’t think that’s where you are going with your argument.
I think these are the salient points:
1) Kansas’ population growth rate is 1/2 that of the U.S. total.
2) Kansas’ population is aging meaning that a greater portion is made up of retirees.
1 + 2) It is more difficult for Kansas to have employment growth with a slower growing population increasingly made up of non-workers.
3) Kansas has historically outperformed the U.S. during recessions because it was less reliant on manufacturing and urban centers, but has not had the growth opportunities for employment as growth periods mature (pretty consistent pattern over 4-5 decades).
4) Kansas outperformed the U.S. for most of the 2011-16 period (based on the average historical relationship, but I’ll concede that is a weak consideration given the other factors).
5) The long-term linear trends (with and without the 2008-09 recession) is a narrowing of the unemployment rates of Kansas versus the U.S. total, driven by diverging demographic trends. https://www.dropbox.com/s/hzywff41pphcmy0/Kansas%20versus%20U.S.%20Unemployment%20Rate%20Differences%20-%20Linear%20Trend.jpg?dl=0
6) The long term trend has been unaffected by political party in power in Kansas.
The last point is one that seems to be a bone of contention.
Bruce Hall: Sorry, perhaps I was unclear. Add in 2011-16, and Kansas performance looks even worse! See added Figure 2.
Yes, I understand, but “worse” is relative to what? 1995-2007, for example? Certainly the quadratic fit would flatten more toward 0.0 as the later data points (2011-16) were added, but that is really beside the point. The real point is that regardless of which form of trend (linear or quadratic) the trend has been inexorably toward parity with the U.S. unemployment rates for decades.
As I pointed out several times on this thread, the mean value is interesting, but pretty meaningless as the relationship changes over time. Also, I pointed out that the recession/recovery/growth maturity pattern of “better” performance early and “worse” performance later has been consistent during these decades of change reflecting the nature of Kansas’ economy and demographics.
So, yes, I was being a bit sarcastic with my comment, but felt that the “performance” measures (mean/quadratic fit) have been avoiding the real dynamics and changes to the long-term employment comparisons driven by significantly different demographics… and irrespective of which political party has been in power.
What I grant you is that Brownback’s promises were ill-advised at best and fictional at worst. Much like Hillary Clinton’s promise to upstate New York. But that’s just politics, not economics.
The discussion began with my assertion that the mean difference was misleading and failed to recognize the changing relationship between employment in Kansas versus the U.S. in total.
The quadratic equation fit shown above is one algebraic tool that can look for a “best fit”, but I believe it is distorted by the recent major economic disruption that affected the rest of the U.S. far more than Kansas. I’ve taken the liberty of using the base chart and applying an “eyeballed” trend line for 1975-2008 and 1975-2016 (no, I’m not going to crank all of the data for a simple visual point). https://www.dropbox.com/s/hzywff41pphcmy0/Kansas%20versus%20U.S.%20Unemployment%20Rate%20Differences%20-%20Linear%20Trend.jpg?dl=0
The real issue is whether or not there has been an underlying change in the relationship between Kansas’ unemployment rates and the U.S. in total. My contention is that there has been a basic change indicated by the linear trend lines on the chart, even if you include the most recent recession. Kansas’ advantage has lessened in recessions and worsened in recoveries. This, I contend, is a long-term trend that shows no sign of reversing regardless of policies; it is a demographic-driven phenomenon.
How can I draw an analogy? Oh, yes. Look at earth’s “average” temperature since 1880. Do we learn more by applying a trend line? Can we ask whether something basic has changed? Or should we apply a quadratic fit and jump at every change in the end point… either up or down?
Perhaps we can try something else like a 5-year or 10-year moving average. Even then, we’d still see an underlying trend that did not just appear a few years ago.
Yes lets keep trying by cherry-picking what data should be included and changing the analytical strategy until we finally (in some tortured way) reach the “correct” conclusion in support of your favorite narrative. (yes that was sarcastic)
And how is selecting either of the two trend lines “cherry picking”. Even including the highly unusual 2008-09 recession and beyond, the trend is clear: the relationship of Kansas’ unemployment to the U.S. total of the 70s and 80s has been changed dramatically away from Kansas’ favor beginning in the 90s.
Also look at the prior recessions and immediate recovery periods. Regardless of the absolute difference in unemployment rates, Kansas always had a significant temporary advantage. The opposite held true for the mature end of the growth periods. The patterns of early advantage and late disadvantage with regard to recessions/recoveries held during the latest recession. However, the absolute advantages following recessions have dwindled dramatically over the past 4 decades while the absolute disadvantages (versus the mean) have increased later in the growth periods.
There is nothing political about those comments. Look at the chart; look at the trends. Kansas’ of the past two decades is not the same as Kansas of the decades prior. There is no “party” responsible for the change in the differences in unemployment rates versus the U.S. total. It is demographics… which I have stated repeatedly.
1975-1979 Robert F. Bennett – Republican
1979-1987 John Carlin – Democrat
1987-1991 John Michael “Mike” Hayden – Republican
1991-1995 Joan Finney – Democrat
1995-2003 Bill Graves – Republican
2003-2009 Kathleen Sibelius – Democrat
2009-2011 Lt. Governor Mark Parkinson – Democrat
So, let’s assume that all the difference between the labor market performance of Kansas (or Wisconsin) and the US or neighboring states is demographic. Then the claim that tax cuts would do wonderrs for the state economy is demonstrated to be false. Same thing that happened under Bush II.
I’m not sure sying that tax-cutters shouldn’t be held to their claims about economic policy, as was suggested earlier in this discussion, is legit. If we are going to aim for a policy literate public, don’t we have to discuss which policies work and which don’t? Isn’t that part of the notion that states represent policy laboratories?
The starting point for MC’s posts about state economic performance is claims made by elected officials about performance. When those claims prove false, that should be of considerable interest to objective observers.
Well said Kalvin Hobbs!
KH, okay, then. I’m inclined to take you at your word.
http://www.stltoday.com/news/national/govt-and-politics/as-senator-clinton-promised-jobs-in-upstate-new-york-her/article_f1048c35-e734-54e9-8137-5c0d47663bd8.html