The Kauffman Foundation has just released its report on startup activity. Wisconsin comes in last place in startup density.
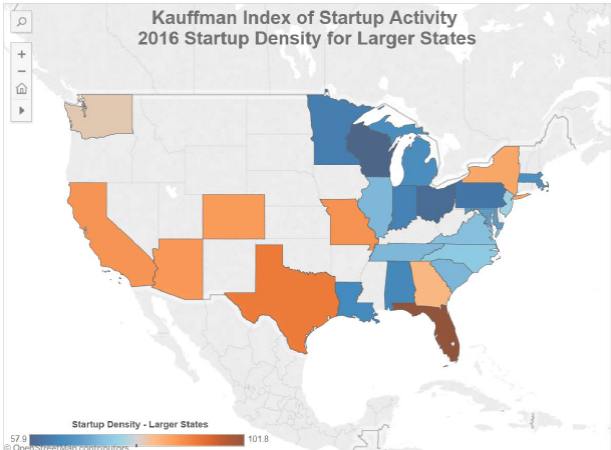
Figure 1: Source: Kauffman Foundation.
From the Milwaukee Journal Sentinel:
For the second year in a row, Wisconsin has earned a bottom-of-the-barrel ranking for start-up business activity, a new report says. Whether that’s as bad as it sounds or simply an unfairly skewed way of looking at the state’s economy depends on the beholder.
According to the report released Thursday by the respected Ewing Marion Kauffman Foundation, start-up activity in the U.S. overall rose in 2016 for the second year in a row. But among the 25 largest states, Wisconsin came in either last or second-to-last in each of the three categories the foundation evaluated.
…
Walker is committed to providing tools that ensure businesses’ long-term success once they’re up and running, Evenson said. Those tools include a tax credit for investors in qualified early-stage businesses, a micro-grant program that helps technology start-ups get federal R&D funding, an entrepreneurial training program on University of Wisconsin System campuses, and seed grant and accelerator programs.
WEDC, the state’s commerce agency, also plans to launch a program in the next few weeks to support “entrepreneurial assistance efforts,” Evenson said.
State policymakers, however, have drained funding from the start-up tax credits, said Joe Kirgues, a co-founder of gener8tor, which runs training programs for start-ups. They have also pursued additional cuts to the UW System and tried to pass stiffer non-compete legislation to further limit the supply of entrepreneurs, he said.
“The formula to turn around our job-creation performance includes a stronger UW system, the elimination of non-competes in Wisconsin and strengthening start-up tax credits to encourage additional investment in Wisconsin’s entrepreneurs,” Kirgues said. “Unfortunately, none of those things happened last year, and these rankings reflect the status quo.”
Given past performance, I have little faith in WEDC accomplishing much in this arena (see e.g., [1]). I also do not see a turn-around in the Governor’s approach to funding the UW system that would suggest a move toward strengthening the system.
The “smile” states are doing best on start-ups, and on population growth. Probably a connection. That suggests we should compare Wisconsin to nearby states. Of course, Wisconsin is at the bottom of the heap in that comparison, too.
Note that Colorado, probably the most libertarian state and the only that has a constitutional amendment restricting tax increases (TABOR), is performing very well according to this metric.
So maybe Wisconsin should become more libertarian, as they maintain a very high tax rate despite having a Republican governor.
Minnesota is next to last.
Steven Kopits: If I read it right WI is 25th, MN is not 24th, using Large states, startup density as criterion. MN is 21st using overall ranking…WI is 25th again.
MN was 24th last year, WI was again 25th last year. Is that what column you were looking at?
I was pulling your chain a bit.
I think I was making a slightly broader case that it is not only the party in power that matters.
Personally, I am focusing more on the Ukraine and South China Sea.
The Russians have started major military exercises:
“Ukrainian military are deeply concerned with sudden inspection of combat and mobilization readiness of the Russian Armed Forces near Ukrainian border on 25-31 August on the orders of Vladimir Putin.
“The training involves up to 100 thousand of Russian soldiers, more than 10 thousand pieces of weapon and military equipment, 60 ships and 400 planes and helicopters. Sudden checking of combat readiness of the Russian Armed Forces is the final stage of preparation to the strategic command-staff exercises ‘Caucasus-2016′, especially the Southern Military District (Rostov-on-Don). Ukrainian military intelligence warns, that the stated purpose of the exercises can be modified by supreme military and political leadership of Russia at any time and may be used for further escalation of the conflict in Donbas. ”
And in the South China Morning Post today:
China has all but ended the charade of a peaceful rise
http://www.scmp.com/comment/insight-opinion/article/2008900/china-has-all-ended-charade-peaceful-rise
Xi is pretty much at the submit-or-fight threshold.
War season in Russia is Aug 1 to Sept. 10, call it. So if something is going to heat up in Ukraine, it will be during the current exercises in the coming week.
Tensions continue to escalate with China, but it’s hard to give a date, and the US and China may not start the war. It could be Japan or Vietnam. Could happen tomorrow, in a month, in a year. With Xi at the helm though, war is inevitable, and in a finite time frame.
Wonder why that is?
What’s Florida doing right?
While I’m at it, here’s the Rand report on the military and economic consequences of a war with China. It corresponds to my own view and it, I think, a very well done report.
http://www.rand.org/content/dam/rand/pubs/research_reports/RR1100/RR1140/RAND_RR1140.pdf
Steven,
One can’t help but wonder to what extent that China’s concerns about: (1) Their declining domestic oil production and (2) Their increasing reliance on net oil imports are driving their military buildup and their actions in the South China Sea.
Following is a headline to a recent WSJ article on China’s declining oil production:
WSJ: China’s Decline in Oil Production Echoes Globally
Implications could include higher crude prices over time as the country increases imports
Note that currently both the US and China are showing increasing net oil imports, for the first time since the 2002 to 2005 time period, when Brent crude oil prices more than doubled from $25 in 2002 to $55 in 2005. The crucial difference between then and now is that circa 2002 to 2005 what I call Global Net Exports of oil (GNE) were increasing at a rapid clip ,versus the so far continuing post-2005 decline in GNE (GNE fell from 46 million bpd in 2005 to 44 million bpd in 2015, total petroleum liquids, BP + EIA data).
Some updated data follow. Given the lack of recent EIA data, I had to use a combination of EIA + BP data for the (2005) Top 33 net exporter data base (for some smaller exporters, I assumed no change in consumption for circa 2013 to 2015).
The Post-2005 Decline in Global Net Exports of Oil, 10 Years Later
I wrote an article on what I called Export Capacity Index (posted in early 2013), using global production and consumption data through 2011. One can find the article by searching for: Export Capacity Index.
Definitions
Net Exports = Total Petroleum Liquids Production less Total Liquids Consumption
GNE = Global Net Exports, Combined Net Exports from (2005) Top 33 Net Exporters
CNI = Chindia’s Net Imports
ANE = Available Net Exports, GNE less CNI
ECI Ratio = Export Capacity Index, the Ratio of production to consumption (at 1.0, net exports = zero)
GNE/CNI Ratio is analogous to the ECI Ratio (at 1.0, the Chindia region theoretically consumes 100% of GNE)
Available Net Exports (GNE less CNI)
Using the BP data base, Chindia’s Net (total petroleum liquids) Imports, or CNI increased from 5.1 million bpd in 2005 to 10.9 million bpd in 2015, which I would round off to 5 and 11 million bpd respectively.
In my Export Capacity Index article, I had a chart showing the GNE/CNI Ratio through 2011. Note that the extrapolation (based on the 2005 to 2011 rate of decline in the GNE/CNI Ratio) shows the ratio falling to just below 4.0 in 2015, on track to approach 1.0 (the Chindia region theoretically consuming 100% of GNE) by 2030.
Using the updated data, the GNE/CNI Ratio fell to 4.0 in 2015 (44/11), on track to approach 1.0 by the year 2032. What I define as Available Net Exports (ANE, or GNE less CNI) fell from 41 million bpd in 2005 to 33 million bpd in 2015. This is the volume of Global Net Exports of oil available to importers other than China & India.
In other words, we have continued to slide toward a theoretical point in time that we cannot arrive at and still have a functioning global economy.
A Math Exercise
The Cumulative Volume of ANE for 2006 to 2015 inclusive, i.e. the cumulative volume of GNE shipped to importers other than China & India for 2006 to 2016 inclusive, was 120 Gb (billion barrels).
Integrating the area under a triangular shaped area, one can estimate the post-2005 Cumulative Volume
of ANE, based on extrapolating the 10 year 2005 to 2015 rate of decline in the GNE/CNI Ratio.
Estimated post-2005 Cumulative Volume of ANE =
15 Gb/year (ANE in 2005) X 27 years (estimated number of years to zero ANE) X 0.5 (area under a triangle), less 15 Gb (2005 ANE) = 200 Gb (rounding up to nearest 50 Gb).
120 GB of ANE were consumed in the previous 10 years, leaving the estimated remaining cumulative volume of ANE, i.e., the estimated cumulative volume of Global Net Exports of oil available to about 155 net oil importing countries, at about 80 Gb.
In other words, based on foregoing, I estimate that in 2015 net oil importers other than China & India consumed about 13% of the total remaining post-2005 volume of Global Net Exports of oil (GNE) available to about 155 net oil importing countries.
In any case, here’s the problem: Given an ongoing, and inevitable, decline in GNE, unless the Chindia region cuts their net oil imports at the same rate as, or at rate faster than, the rate of decline of GNE, it’s a mathematical certainty that the resulting rate of decline in ANE will exceed the rate of decline in GNE and that the rate of decline in ANE will accelerate with time.
Based on the foregoing, the observed rate of decline in GNE from 2005 to 2015 was 0.4%/year, while the observed rate of decline in ANE was 2.2%/year.
China’s crude oil output down in July
http://news.xinhuanet.com/english/2016-08/27/c_135638323.htm
Jeffrey –
I have little doubt that oil plays some role in South China Sea developments. China’s oil production looks potentially post-peak–our Douglas Westwood forecast back in 2010 called for a peak around 2015. However, CNOOC has done pretty well offshore, and although China’s shale oils have not panned out to date, we’ve been consistently surprised to the upside by shale technology developments.
I am personally under the impression that fish matter more.
In principle, the fish stocks in the South China Sea are more likely to be afflicted by the tragedy of the commons than any other place in the world.
Key factors:
1. an enclosed body of water of finite size, roughly 700 x 1000 miles, depending on where you want to draw the border
2. surrounded by huge populations on all sides, perhaps 2 bn people in total
3. exploitation characterized by rapid regional economic growth and rapid technological progress, thereby leading to both more extensive and intensive utilization
4. poor governance and fragmented ownership with ill-defined and policed borders
I suspect the SCS is in far worse shape than is currently appreciated, with the result that national fishing fleets are wandering ever farther from their own waters, leading to a kind of range war in the region.
Governments have become involved. For example, here is a story on Indonesia blowing up 60 foreign fishing vessels
http://www.voanews.com/a/indonesia-illegal-fishing/3469076.html
And China has attacked Vietnamese fishing vessels
http://foreignpolicyblogs.com/2016/05/13/chinese-boats-continue-attacks-vietnamese-fishing-boats/
The region desperately needs constructive leadership from China. Not happening, though.
https://www.fastcompany.com/3007772/united-states-innovation-ranking-states-and-district-innovation
Uses the Kaufman rating system and some other factors that are relevant.
RANKING THE STATES (AND A DISTRICT) FOR INNOVATION
1 // Florida 2 // Texas 3 // Maryland 4 // Arizona 5 // Alaska 6 // California 7 // Colorado 8 // New York 9 // New Jersey 10 // WashinGton, D.C. 11 // Nevada 12 // Connecticut 13 // Georgia 14 // Delaware 15 // New Hampshire 16 // Missouri 17 // Rhode Island 18 // Utah 19 // South Carolina 20 // Kentucky 21 // Vermont 22 // South Dakota 23 // Wyoming 24 // North Carolina 25 // Montana 26 // Washington 27 // Idaho 28 // Virginia 29 // Hawaii 30 // Maine 31 // New Mexico 32 // Wisconsin 33 // North Dakota 34 // Oregon 35 // Ohio 36 // Indiana 37 // Arkansas 38 // Illinois 39 // Michigan 40 // Tennessee 41 // Massachusetts 42 // Nebraska 43 // Pennsylvania 44 // Alabama 45 // Iowa 46 // Minnesota 47 // Kansas 48 // Louisiana 49 // Mississippi 50 // Oklahoma 51 // West Virginia
Here is a map of the data from Fast Company on innovation ranking by state.
https://www.dropbox.com/s/zdaqxa4hvnjs347/States%20Ranked%20For%20Innovation%20-%20Fast%20Company.JPG?dl=0
It is not limited to just larger states. Note the clustering/ranking in the north central states. Incidentally, Wisconsin’s ranking was 32, not 33 as indicated in my previous comment.
Obviously, these data (which include the Kauffmann data) as well as the stand-alone Kauffmann data offer only a small slice of the overall economic activity by state.
Hmm… Among the states populous enough to be colored, which ones have economies dominated by booming metropolitan areas? I think that correlates pretty well.
I think that finding a single metric representing a state’s competitiveness might be a futile exercise. CNBC, in July 2016, put together an analysis of 60 metrics and consolidated them into 10 categories and an overall score. Again, this is subject to debate, but it’s interesting.
http://www.cnbc.com/2016/07/12/americas-top-states-for-business-2016-map-of-state-rankings.html
data here: http://www.cnbc.com/2016/07/12/americas-top-states-for-business-2016-the-list-and-ranking.html
I find it interesting that while $250 million was cut from the UW System, funding was provided for Wisconsin Economic Development Corporation (a state agency) programs such as a ” entrepreneurial training program” and “seed grants.” How efficient are government agencies at identifying innovative business start-ups? Isn’t money better spent on educating individuals and then letting them create new businesses?
Over the past few decades, spending on education has skyrocketed, while business start-ups declined. Perhaps, student debt has a negative impact.
Wisconsin is rated high in small business survivorship.
Kauffman surveyed over 12,000 small business owners on business friendliness and found:
“Small business owners in Utah, Idaho, Texas, Virginia and Louisiana gave their states the highest rating for friendliness to small business.
Small businesses in Colorado Springs, Boise and Houston gave their cities the highest ratings.
In contrast, small business owners gave California, Rhode Island and Illinois an “F,” while Connecticut and New Jersey both earned a “D” grade.
Sacramento, Providence and Buffalo were the survey’s worst-performing cities as rated by their small business owners.”
I have my doubts about the wisdom of the method/criteria – Just look at the conclusions: Sacramento in California is higher rated than San Jose (Silicon Valley). And Washington DC is near the top, higher rated than California.
It seems that lobbying politicians counts as Entrepreneurial / Start-up activity. A bit less of that kind of “start ups” would possibly be a good thing
Wisconsin ranks 33rd in job creation
http://www.jsonline.com/story/money/business/2016/09/07/wisconsin-ranks-33rd-job-creation/89932888/
and this
Fading College Dream Saps U.S. Economy of Productivity Miracle
http://www.bloomberg.com/news/articles/2016-09-07/fading-college-dream-saps-u-s-economy-of-productivity-miracle
Maybe Wisconsin should put more resources into its universities?
I have little hope this will happen as the state legislators put forward their agenda:
http://legis.wisconsin.gov/eupdates/asm63/ForwardAgenda2016.pdf
One can only imagine the draconian state budget being formulated for the next two years.