Christiane Baumeister and Lutz Kilian presented an interesting paper at the Brookings Institution last week that takes a detailed look at the effects on the U.S. economy of the dramatic oil price decline of 2014-2015.
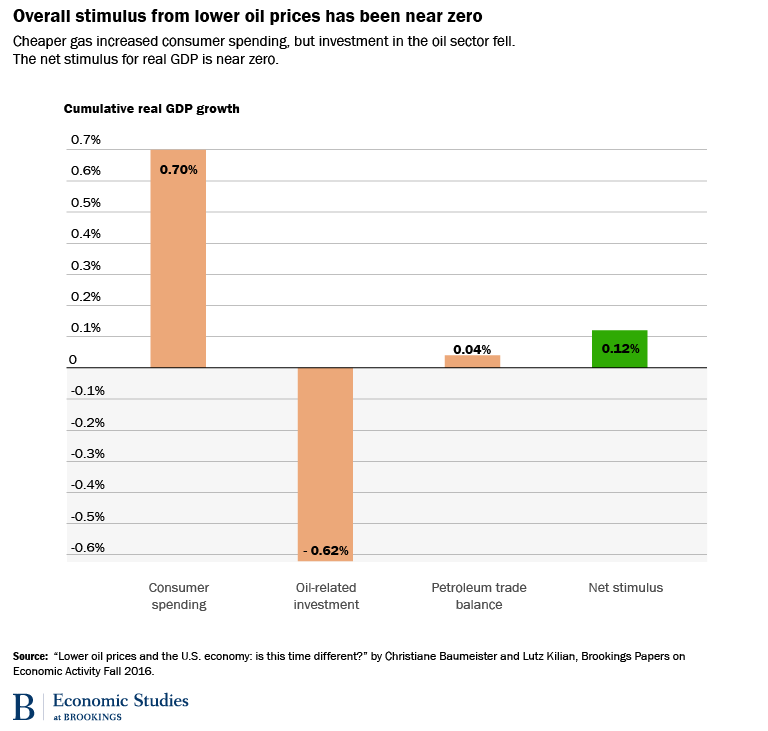
An oil price decrease loosens consumers’ budget constraints, and historically this tends to show up as higher consumption spending. I had done some earlier analysis suggesting that might not be happening this time. But Baumeister and Kilian update those calculations and conclude that there was a significant boost to consumer spending, noting that real consumption spending grew on average by 3.1% over the two years since oil prices began falling in 2014:Q3 compared with only 2.0% during the preceding two years. Their conclusion is also consistent with the finding from a JP Morgan Chase Institute analysis of individual credit card histories.
But gains to consumer spending were mostly offset by a drop in oil-related investment spending. Nonresidential fixed investment had been growing at a 4.3% rate prior to the oil-price drop but has only increased at a 0.8% annual rate since, due to a 50% drop in investment spending in the oil sector.
The U.S. imports 6 million more barrels of crude petroleum and refined products than it exports every day. Between June 2014 and March 2016 the real price of oil declined by 68%. As a net oil importer, the fact that Iraq and Iran are now willing to sell us more oil at a lower price should be good news for the U.S. economy. In idealized economic models, the resources that had been producing oil should now shift to producing other goods, and with the new terms of trade we should as a result be even more productive than before.
But in the real world shifting resources is easier said than done. We now have a large stock of capital that was being used to develop U.S. shale oil, and contrary to the predictions of simple economic models, there is not some other more productive place to use that equipment. One very interesting part of Baumeister and Kilian’s analysis was a look at the performance of individual sectors. Somewhat surprisingly, there wasn’t even any significant gain in the transportation sector, the one area you might have expected to enjoy the biggest windfall from lower oil prices. The weak performance in transportation comes from a big drop in rail shipments, dominated by lower rail transport of petroleum. Idealized economic models treat capital as if it’s a big fungible lump that you can use wherever it’s most productive. But it turns out to be not that easy to try to carry milk in an old oil tanker rail car.

Indexes of truck tonnage, airline passenger traffic, and rail freight loads. Source: Baumeister and Kilian (2016).
Their paper examined a number of details of the economic response. The bottom line is that there seemed to be little net stimulus to the U.S. economy from the collapse in oil prices.
Good analysis.
I would add, however, that a look at non-petroleum related sectors would be worth a go.
Here in Princeton, road traffic is becoming progressively worse, noticeably again with the start of the school year, with congestion materially worse than the same time last year.
I’m not persuaded by this analysis at all, based on what has been presented.
It does not appear from this report that the authors made any attempt to separate out the effects of the nearly 20% appreciation of the US$ against major currencies — which really hurt exports while aiding imports.
Specifically, if you go to the website of the American Associatioin of Railroads, and look up its weekly freight data, here: https://www.aar.org/data-center/rail-traffic-data
you can easily see that it is the decline in *coal* shipments, not petroleum, that was the lion’s share of the downturn, and further that things like industrial metals and grain were similarly affected.
Maybe those concerns were addressed in the study and I missed them, but based on the evidence presented here, I do not agree with the conclusion at all.
New Deal democrat: Thank you for the website showing rail traffic. The Monthly Rail Traffic Data on this website show that coal dropped starting in February 15, whereas petroleum dropped starting in November 2014 (and much more than coal cumulatively). In the paper we had stated that rail volumes declined after June 2014, reflecting the declining volume of oil shipments as well as the economic slowdown starting in 2015. It seems to me that this assessment is accurate.
As to the exchange appreciation, to the extent that the dollar appreciation was systematically tied to the unexpected oil price decline, the model we use would capture this effect in the cumulative response of consumption to the unexpended decline in gasoline prices. If the appreciation was not related, it would show up as a separate and distinct shock in the model. Since we are concerned with the response to unexpected low oil and gasoline prices, an independent “exchange rate shock” would be irrelevant for our analysis of the causal effects of the unexpected oil price decline (even though it is relevant for the economy). Note that our methodology does not presume that there are no other shocks in the economy.
I am going to continue and amplify my disagreement.
The AAR site is interactive and is quite clear. At no point does petroleum hauling decline by more than roughly 1/3 or about 6000 cars a week. By contrast coal declines about 50% at its worst, from about 120,000 to 60,000 carloads per week! The site also allows for comparison ex-coal. At no point are the comparisons ex-coal off by more than about 15% a week. I do not see how it can possibly be said that petroleum “dropped much more than coal.”
I would be much more impressed with the analysis if you considered an independent exchange rate shock rather than assuming it is irrelevant to your analysis. In the big 1986 decline, the US$ also declined. In the smaller 2006 gas price decline, the US$ remained steady. The 2014-15 is unique among recent oil price declines in the coincident surge in the value of the US$, and to my mind is a much better explanation for the widespread subsequent economic weakness.
New Deal democrat The carload data for coal show a decline by about 41% (from 110 to 65) by March 2016, but by August the cumulative decline has shrunk to about -18% (100 to 90). For oil, the respective cumulative rates of decline are about -31% and about –37%. This is just based on eyeballing the charts. Which cumulative decline is larger thus depends on what dates one focuses on. I was looking at the entire chart. In any case, this discussion about cumulative declines is missing the point that there was no systematic decline in coal traffic before early 2015, but there was in oil shipments. Thus, the website you mentioned supports the claim in our paper about oil shipments falling in late 2014 and there is nothing to quibble about.
Your comment is also missing that in the paper we explicitly attributed the overall decline in rail transport to both declining oil shipments and the economic slowdown starting in 2015. The latter effect includes declines in coal and other rail shipments, so there is really no room for disagreement. In fact, the weakness in commodity markets is also discussed elsewhere in the paper, so the evidence on coal shipments is not telling us anything new.
As to the exchange rate issue, what you are saying is that you would have preferred us to write a paper about the relationship between the appreciation of the dollar and the U.S. economy. That was not the question we were asked to answer by Brookings. Our job was to write a paper about the effect of unexpectedly low oil prices on the U.S. economy. Moreover, we explicitly discuss the role of exports and imports in accounting for the comparatively low real GDP growth. Obviously, we are not taken a stand on what the role of the exchange rate might have been in this context, but our analysis leaves plenty of room for other explanations of U.S. real GDP growth.
Let me conclude by saying that it is difficult to be impressed by a paper that one has not read, so, unless you are only interested in exchange rates, I would like to encourage you to actually have a look at our analysis.
Lutz Kilian
I will leave this so that people can draw their own conclusions. First, the AAR prepares weekly reports with specific cumulative numbers.
Here is the entire year 2015 in terms of number of carloads and the YoY change:
https://www.aar.org/newsandevents/Freight-Rail-Traffic/Documents/2015-12-30-railtraffic.pdf
Coal: 5.1m -11.5% YoY
Petroleum: .7m -9.5% YoY
Here is 2016 so far:
https://www.aar.org/newsandevents/Freight-Rail-Traffic/Documents/2016-09-14-railtraffic.pdf
Coal: 2.7 m -26.5% YoY
Petroleum: .4 m -22.3% YoY
Coal has a bigger cumulative decline by far since the beginning of 2015.
Metallic ores also had a bigger cumulative decline both in carloads and % declines than petroleum in 2015, although not so far in 2016.
I did read the Brookings presentation linked to by Prof. Hamilton, which does not contain a link to the underlying paper. In relevant part, that presentation states:
“The authors make a point of comparing the most recent oil price drop with events in late 1985,… The main difference between then and now is that the decline in oil-related investment after June 2014 was about twice as large….
“This is not the only difference, however. The authors point out that the price drop in 1986 was caused by developments in the global oil market alone, whereas in 2014-15, it was also associated with a global economic slowdown which is presumably reflected in a lower average rate of growth in U.S. real exports. Had U.S. real exports continued to grow at the same average annual rate of 3.2 percent as between the first quarter of 2012 and the second quarter of 2014, Baumeister and Kilian note, average U.S. real GDP growth after mid-2014 all else equal would have increased by 0.3 percentage points to 2.5 percent (up from 1.8 percent on average between 2012 and mid-2014).”
The Brookings report does not include any information on what if anything was done to separate oil-price-decline effects from other effects, such as the nearly 20% surge in the US$. Maybe the authors’ paper did so. All I can say is that I have no way of knowing from the Brookings report. What is clear is that, in addition to the decline in oil related investment, and the global slowdown, what was also different this time was the rapid appreciation of the US$.
I would welcome further information from the authors and others on the relative impacts of the disruption in the oil patch vs. other factors, both limited to the effects of the price decline, and the broad economy.
I was reminded of an article from 2014, on David Stockman’s website (it was a repost of an article from another blog), to-wit, presumably through mid-2014 or so, there was no net job growth in the US outside of the five shale play states, since the Great Recession:
http://davidstockmanscontracorner.com/jobs-shale-debt-and-oils-minsky-moment/
Although, there’s not much net change in GDP, substantially lower oil prices are a big benefit for the U.S. economy.
We spend much less both on producing oil and consuming oil by importing much cheaper oil.
Exchanging much fewer goods for the same barrel of oil (improved terms-of-trade) is a big benefit.
maybe the trouble is “the accumulation of consumer debt by the bottom 60% has been distressing, as ~70% of all new student debt ($805B), 56% of new credit card debt ($88B), and 59% of new auto debt ($680) now resides on their balance sheets. Referring to the chart below, we can see that the bottom 40% of earners began expanding debt at a faster rate than income in Q313, with the 40-60 bracket joining towards the back half of 2015. This rate has progressively accelerated into the most recent quarter, which to us is an indication that lower and middle income households are currently stressed and underwater. ” http://pervalle.com/2016/09/music-stops-us/
So I wonder how Team Trump squares the extremely low elasticities found in the Brookings study with the very high labor supply and investment responses implied by the Tax Foundation’s model.
You think Team Trump has to square this, do you?
It is not correct that the fall in oil prices after Q3 2014 resulted in a rise in consumption expenditure.
See the graph on https://fred.stlouisfed.org/graph/?g=7ePm
Also interesting is this graph: http://www.philipji.com/item/2015-10-04/us-recessions-and-recoveries-over-55-years
Philip George: Not sure I see your point. The graph certainly shows, as I reported, that consumption growth last two years came in stronger than previous two years. There’s a lot of detailed analysis of this in the paper.
Mr. Hamilton,
Thank you for your articles.
Given the expedited transformation to all-electric vehicles, has your view that the oil glut will dissipate changed? Or would you say that a decline in demand will move the equilibrium price lower?
Thank you.
Plug-in EVs sales, forecast around 140,000 units this year, represent about 0.8% of all cars sold in the US. This has been increasing by around 0.1 pp per year. Thus, by 2030, plug-in electric vehicles may constitute 2% of all US car sales.
Thank you for your response. Please consider that battery tech is improving exponentially, therefore linear projections may understate penetration. Tesla alone plans to sell 500,000 all-electric cars in 2018, 1 million in 2020, and most other manufacturers have plans to “electrify” their line up in the coming years.
rightly stated. it is inappropriate to linearly project an emerging technology into the future. new ideas and concepts rise exponentially when they are adopted, that is why they are technology disruptors. There is absolutely no way electric vehicles will only account for 2% of car sales in 2030. the age of gasoline automobiles is coming to an end. the future is electric and digital my friends.
I’m one of those consumers who would love to justify the purchase of an electric vehicle, but find the lack of support infrastructure, limited range (especially in cold, northern winters), and premium pricing for relatively small vehicles with minimal alternative utility (cargo capacity) to be off-putting.
Count me in as a customer when I can get a 400-mile range, a 5-10 minute recharge, charging stations as ubiquitous as gasoline stations, and low-cost battery pack replacements… at the same price (or very small premiem to) as a turbocharged 4-cyl. gasoline engine. Until then, I have to agree with Steven Kopits… maybe 20% by 2030.
“Ulenspiegel, something that’s relatively tiny can double quickly.”
The point you obviously miss is that wind power and PV are in many cases the solution with the lowest costs. Therefore, there is no reason we won’t see three or four doublings steps before 2030.
“That doesn’t mean renewable energy will be 75% of electricity In one generation or solar and wind will represent a big percentage of electricity in one generation.”
Globally I assume that at least 50% of the elctricity is generated by REs around 2045-50, most of this will be wind and PV.
“Right now, fossil fuels, nuclear, and hydroelectric seem to supply about 98% of electricity.”
Again, you simply ignore the dynamic of the transition.
I think a better way to consider this issue is to talk about comparative advantage. Either EV’s will be superior to ICE vehicles, or they won’t, with ‘superiority’ defined as providing more (internalized) features or offering lower cost of ownership. If EVs are superior, then we should assume a dominant market share for EVs by 2030. If they aren’t, then EVs will remain the niche technology they have been for over a century and a 2% market share is entirely plausible.
Steven, the one area EVs have an advantage over ICEs is acceleration. Max torque instantly. But unless you are a glutton for speeding tickets, that is a minor consideration. Range, recharging time, infrastructure support and initial cost are all the major relevant factors affecting buying choices.
As i mentioned in a previous post, I would be a purchaser of an EV if the major factors could be resolved. If we presume that battery technology will improve significantly to address range and recharging time, the issues of infrastructure support (charging stations) and initial cost remain. Also, for those who like to keep their vehicles rather than leasing, replacement cost of batteries is a consideration.
Your estimate of 2% market share by 2030 may be pessimistic, but not totally unrealistic.
Remember ICE technology is not standing still (pun intended) either.
Bruce, fully understand your considerations. At the same time, you may find significant expansion of market share without achieving those concerns 100%. In particular, the EV concept works well in the urban environment, especially for commuting purposes. With 250-300 mile range (obtainable soon), you can exceed many gas powered vehicles in city driving. Regarding power sources, many parking garages are now equipped to handle recharging in metro areas. There is no reason to believe that will be an impediment going forward. battery technology will continue to improve, probably much faster than you expect. places such as the gigafactory by tesla will see to this.
one thing that both bruce and steven underestimate is the demographic impact on gas versus electric. you are both “old” in your perception of change-although i do not mean that in a derogatory way. the future of autos will be decided by x and millennial generations, the “young” if you will. i work with the brightest of this generation daily, and there appears to be very little affection shown to the gas powered world. they are an electric and digital society, and many view the EV as an extension of their digital and online world. the gas powered vehicle really does not fit into their vision of the future. the baby-boomers may have preferred gas, but they are dying off and becoming less important in decision making for the next decade. finally, the inefficiency of the ICB compared to electric motors makes it very hard to justify the continued use of the ICB. coupled with it apparent environmental problems, i imagine a continued lack of support in the ICB in the coming years-especially in the urban areas.
According to 2009 data from the OECD Factbook, the sources of electricity worldwide were as follows:
Fossil fuels 67% [coal (41%), oil (5.1%), natural gas (21%)]
Renewable energy 16% [mainly hydroelectric (92%), wind (6%), geothermal (1%), and solar (1%)]
Nuclear power 13%.
“they are an electric and digital society, and many view the EV as an extension of their digital and online world. the gas powered vehicle really does not fit into their vision of the future. the baby-boomers may have preferred gas, but they are dying off and becoming less important in decision making for the next decade…”
This comes under the category of ‘fashion’. Fashion is tricky basis for a lasting value proposition.
Peak Trader wrote:
“According to 2009 data from the OECD Factbook, the sources of electricity worldwide were as follows:
Fossil fuels 67% [coal (41%), oil (5.1%), natural gas (21%)]
Renewable energy 16% [mainly hydroelectric (92%), wind (6%), geothermal (1%), and solar (1%)]
Nuclear power 13%.”
You compare stagnating or lineally declining technologies with technologies which are exponetially growing, with a doubling in 2-3 years for PV, around 4-5 years for wind.
From 1% to 64% are onyl 6 doublings, i.e. around 15-20 years for PV. For wind, from 5% to 40% only three doublings or 15 years.
While I do not assume that we will actually see this extreme development but some kind of saturation and a more linear growth before, the relevant timeframe is less than one generation from 75% fossil fuel to 75% RE.
steven, i would not have described it as “fashion” but i do see your point. now i have a question to ask an “old” person. how well can you predict the “fashion” preferences of the “young” generation? can you even understand their choices and decisions? disagreements usually exist between generations.
but if you want to discuss from a value perspective, here is another question. if you were to build a new transportation infrastructure today, would it be electric based or oil based? i certainly know what the “young” would choose, and it is not oil. and in the cities, it probably would not even include individual automobiles.
Ulenspiegel, yet, wind and solar supply very little electricity today.
How do you know renewable energy will supply 75% of the electricity in one generation?
It’s possible, clean coal technology, for example, (there’s an abundance of coal) will continue to supply the bulk of electricity in one generation.
Who predicted fracking one generation ago?
Baffs –
Usually fashion and innovation go together. Thus, a better product is often fashionable. But not always. Clothing is an example. Music is another.
However, with automobiles, we can subject them to a number of objective tests, notably price, cost of ownership, capacity, performance, reliability, etc. Fashion also counts, but not that much. If it did, we would all be driving convertible Mustangs and Miatas. In truth, we mostly drive Camry’s and Accords, and the football favorites F150 and Chevy Silverado pick-up trucks.
But ok, if I add up all the exotics–Telsa, Alfa, Jaguar, Land Rover, RR, Lamborghini, Porsche, Bentley, Ferrari, Maserati, Mini, Smart and Fiat–all those together are 1.7% of the market. If I add to those Mercedes, BMW, Audi and Volvo, it’s 5.0% of the market. So if you displaced every ‘fashionable’ import with fashionable electric vehicles, the upper limit of your market share is 5%, and maybe not more than 2%.
Fashion won’t carry you in the auto biz. It has to be better or cheaper.
steven, you are taking the “fashion” statement incorrectly. by fashionable, we imply favored status. the favored status in gas powered cars is exactly what you stated-camry and accord class of cars. reliable and dependable, boring, but nevertheless very popular. people buy them because they are reliable, dependable and cost effective. those are traits that can easily develop in the EV class. think of tesla. the current crop of sports cars is not what they are building their future on-its the cost excuse to develop the technology. the future is in the model 3-the direct competitor to camry and accord. high volume. your ferrari type discussion is not quite accurate.
i think the “older” generation fails to understand many of the “younger” generation have no strong desire for automobiles as a status symbol. think utilitarian-that is why the suv and ultimately the compact suv has become so popular. but the younger generation has no interest in “cruising” and working under the hood. the car is simply a means to get from point A to point B. electric cars, integrated into their digital world, appear to be closer to their wants. drive share, uber, etc provide strong evidence of this point of view for the younger crowd. the price of the EV will continue to drop, and for the financially struggling millennial, this will prove attractive.
Baffs –
If the “future is in the [Tesla] model 3-the direct competitor to camry and accord. high volume”, then it is competing on price and features, not fashion.
If it can beat the Accord and Camry on price and features, then it will take their market, and then EV’s will have a market share north of 50% by 2030. If it can’t then EVs will have a tiny market share, as they do today.
And just for the record, Tesla’s US market share is 0.2%.
Peak Trader: “Ulenspiegel, yet, wind and solar supply very little electricity today.
How do you know renewable energy will supply 75% of the electricity in one generation?”
Again, to use one point without analysing the dynamic of the developement is a useless exercise. Coal is stagnating, nuclear power decreasing, RE growing exponentially with a doubling each 2-4 years.
If you actually checked the costs of NEW capaicity (plus costs of integration) than it would become obvious that we have reached the point in many countries where REs are the economically best choice. Projects for new NPPs and coal power plants die at the moment for basic economic reasons. End of story.
As new technologies need many years for developement, testing and impementation it is IMHO a save bet that for at least ten years the current rate of REs will continue, and afterwards (with >50% RE) the integration of base load power plants would be a PITA.
Ulenspiegel, according to the EIA, renewable energy grew from 6.2 quadrillion BTU in 2006 to 8.6 quadrillion BTU in 2015. That doesn’t look like exponential growth to me.
peak, do those numbers include hydro? they began with a much higher starting point and remained rather steady. it is the modern idea of renewables-such as wind and sun without hydro-that Ulenspiegel is referencing. their production, in percentage terms, has increased well over that time period.
steven, the model 3 is already in the same category in price and features-without the benefit of true economy of scale. yet. in the long run, the gas powered vs EV will probably play out the same way as the mechanical analog computer and the digital computer revolution.
Peak Trader “Ulenspiegel, according to the EIA, renewable energy grew from 6.2 quadrillion BTU in 2006 to 8.6 quadrillion BTU in 2015. That doesn’t look like exponential growth to me.”
Hydro is stagnating in many countries and IMHO should not expected to grow much in future, a large scale substitution of fossil fuel can only come from PV and wind turbines.
Globally installed PV capacity:
2009 23 GW
2011 70 GW
2013 139 GW
2015 257 GW
Gobally installed wind turbine capacity, this underestimated output as older turbines have a low CF:
2007 94 GW
2011 238 GW
2015 432 GW
We see a doubling of PV each 2 yeras, of wind each 4 years.
Ulenspiegel, something that’s relatively tiny can double quickly.
That doesn’t mean renewable energy will be 75% of electricity In one generation or solar and wind will represent a big percentage of electricity in one generation.
Right now, fossil fuels, nuclear, and hydroelectric seem to supply about 98% of electricity.
I suspect, in one generation, they’ll still supply over 90% of electricity.
peak,
“I suspect, in one generation, they’ll still supply over 90% of electricity.”
with respect to electricity supply excluding renewables.
steven,
“Thus, by 2030, plug-in electric vehicles may constitute 2% of all US car sales.”
i’ll take you both up on that offer. EV’s and renewables are no longer a “niche” field. they are major focuses in most research universities. the largest, most valuable, high tech companies have strong interest in these directions-apple, google, facebook, etc. intellectual capital and real capital appear to be taking the opposite side of your view as well.
Looks reasonable to me, Jim. It was a bit of a mystery, the apparent lag in consumer spending response. There were reasonable reasons why it should happen, caution after the long bad economic times and people trying to get their balance sheets a bit more in order. But indeed, it is reasonable that eventually the loosening of the budget constraints would show up as they apparently they have in higher consumption spending.
Of course there has been a fall in oil sector investment. The question is why we have not see any pickup in investment in other sectors. I gather there has not been any (oh, I know. all the fault of Obamacare or something).
Anyway, while this was not your point, this is not a bad moment to remind people that when the FOMC meets, what gets debated is not just high level macro theories and the accuracy of national level macro data and trends and so on, but the state of regional economies, with the regional Feds very much representing their regional economies. Those regional economies are more likely to get out of synch with each other when what is driving things is major changes in oil prices. However, these debates rarely surface or get reported on much outside of FOMC meeting rooms.
If you look back at the 1986 oil price collapse, it took about a year before consumers really responded. My guess is that consumers want to be sure it is not just a blip of relief before they loosen the pursestrings.
Because he’s too humble, I’ll provide this link to readers as, IMO, a very useful supplement to the discussion.
https://www.brookings.edu/wp-content/uploads/2016/09/discussantpresentation_hamilton.pdf
Good blog.
I believe a major economist once opined that a large fraction of the impact of oil prices on the U.S. economy came from the monetary policy reaction function to oil prices.
In other words, the FOMC has their foot on the brake, so this is not a huge surprise. Any potential increase in GDP growth (and declining unemployment), would be met with quicker rate hikes.
Here’s a reprise of the January 2014 Columbia University presentation on Global Oil Markets Forecasting.
I certainly did not think at the time that shales would perform so strongly just a few months later (and believe me, I haven’t forgotten), but on the whole the presentation holds up and is germane to the discussion here.
It’s been viewed an astounding 21,000 times. I have no idea by whom.
https://www.youtube.com/watch?v=dLCsMRr7hAg
I am one of those who watched it, and, alas, bet on it!
WHEN DID I SAY THAT? YOU ARE MISTAKEN.
Adjustments to oil prices can take a long time. See:
Airfares Continue to Plunge: What’s in Store for Airline Stocks?
Hello Mr. Hamilton!
If possible, I would very much appreciate an update to your Nov-2014 article “A Glut of Oil?” as we approach the two-year anniversary. A lot has changed since your article, both on the demand and on the supply side, and I believe many of your readers would love to read your updated views.
Specifically, I am curious about your thoughts on the productivity gains achieved new-well oil production per rig. I’m referring to the upward rising line in the upper-left graphs on almost each page of the following report: http://www.eia.gov/petroleum/drilling/pdf/dpr-full.pdf.
https://econbrowser.com/archives/2014/11/a-glut-of-oil
Thank you!
Yaman