Today, we’re pleased to present a guest contribution written by Laurent Ferrara (SKEMA Business School and International Institute of Forecasters) .
The NBER Business Cycle Dating Committee officially announced on June 8 that the peak of the U.S. Covid-related recession was in February 2020. This announcement was done very rapidly after the occurrence of the peak, due to the very specific nature of this recession. In this post I compare U.S. recessions since WWII by assessing their severity, defined as their amplitude multiplied by their duration.
On June 8, the NBER Business Cycle Dating Committee (BCDC) officially announced that the peak of the U.S. recession was reached in February 2020. Some previous Econbrowser posts already suggested that February was indeed the end of the longest economic expansion in history (128 months), see for example here and here.
What is more surprising is to see that it took only 4 months to the NBER BCDC to officially announce this recession. In general, the delay between the date of business cycle turning points and their official announcement is much longer. The average delay (since 1980) for peaks is 7.3 months, while the average delay for troughs is 15.2 months (see Figure 1). This gap between peaks and troughs reflects the well-known business cycle asymmetry between expansions and recessions. It also reveals that it takes more time to identify when a recession ends rather than when it starts. As regards the current recession, its specific nature due to a well identified external shock makes that the BCDC rapidly decided to call for a recession.
Figure 1. Delays of official recession announcements by the NBER BCDC since 1980
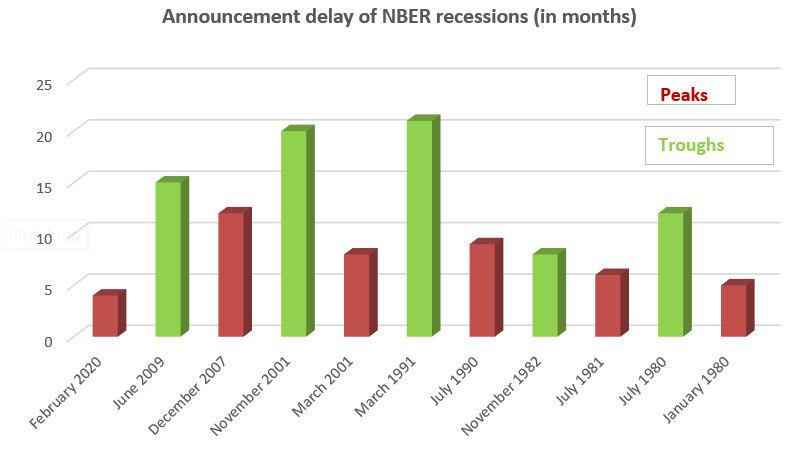
Source: NBER BCDC
Another stylized fact of the current recession is its unusual large amplitude. U.S. GDP dropped by 5% in 2020 Q1 (compared to 2019 Q4 in annualized terms) and is likely to drop again by about 40% in 2020 Q2 according to current nowcasts from NY Fed and Atlanta Fed. This is why the NBER BCDC didn’t hesitate to rapidly call for a recession. Even if the recession is likely to be quite short (2 quarters according to CBO forecasts), its severity is likely to be quite strong. The severity of a recession is defined in the literature as its amplitude multiplied by its duration and divided by 2 (see Harding and Pagan, 2002, or Darné and Ferrara, 2011). As shown in Figure 2, the severity index measures the area of the triangle ABC. The amplitude is measured by the drop in GDP level between the peak and the trough (expressed in percentage terms), while duration is given by the NBER BCDC.
Figure 2. Amplitude and durations of recessions
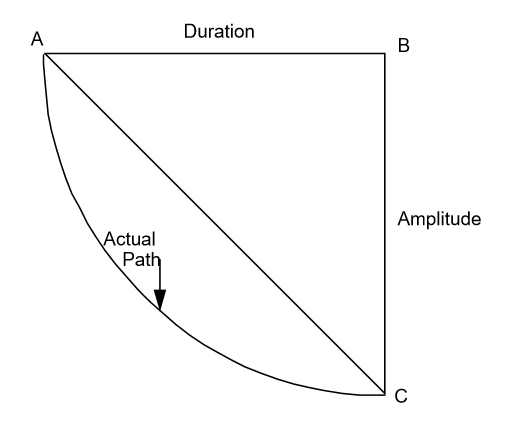
Source: Harding and Pagan (2002, Journal of Monetary Economics)
Severity indexes for previous U.S. recessions are presented in Figure 3. The severity of the current recession is computed based on CBO forecasts (-39.6 % in Q2 2020 compared to Q1 in annualized terms), assuming thus that it will last only 2 quarters. Under this hypothesis, we get that the severity of the Covid recession will be large but of same order as the one of the Great Recession in 2008-09 (lower duration but stronger amplitude). Thus this large expected severity induced the NBER BCDC to not wait as long as usual to officially call a recession. Interestingly, we also note that the severity index for the 2001 and the 1970 recessions are today positive (based on current real GDP from BEA).
Figure 3. Severity of U.S. recession since WWII
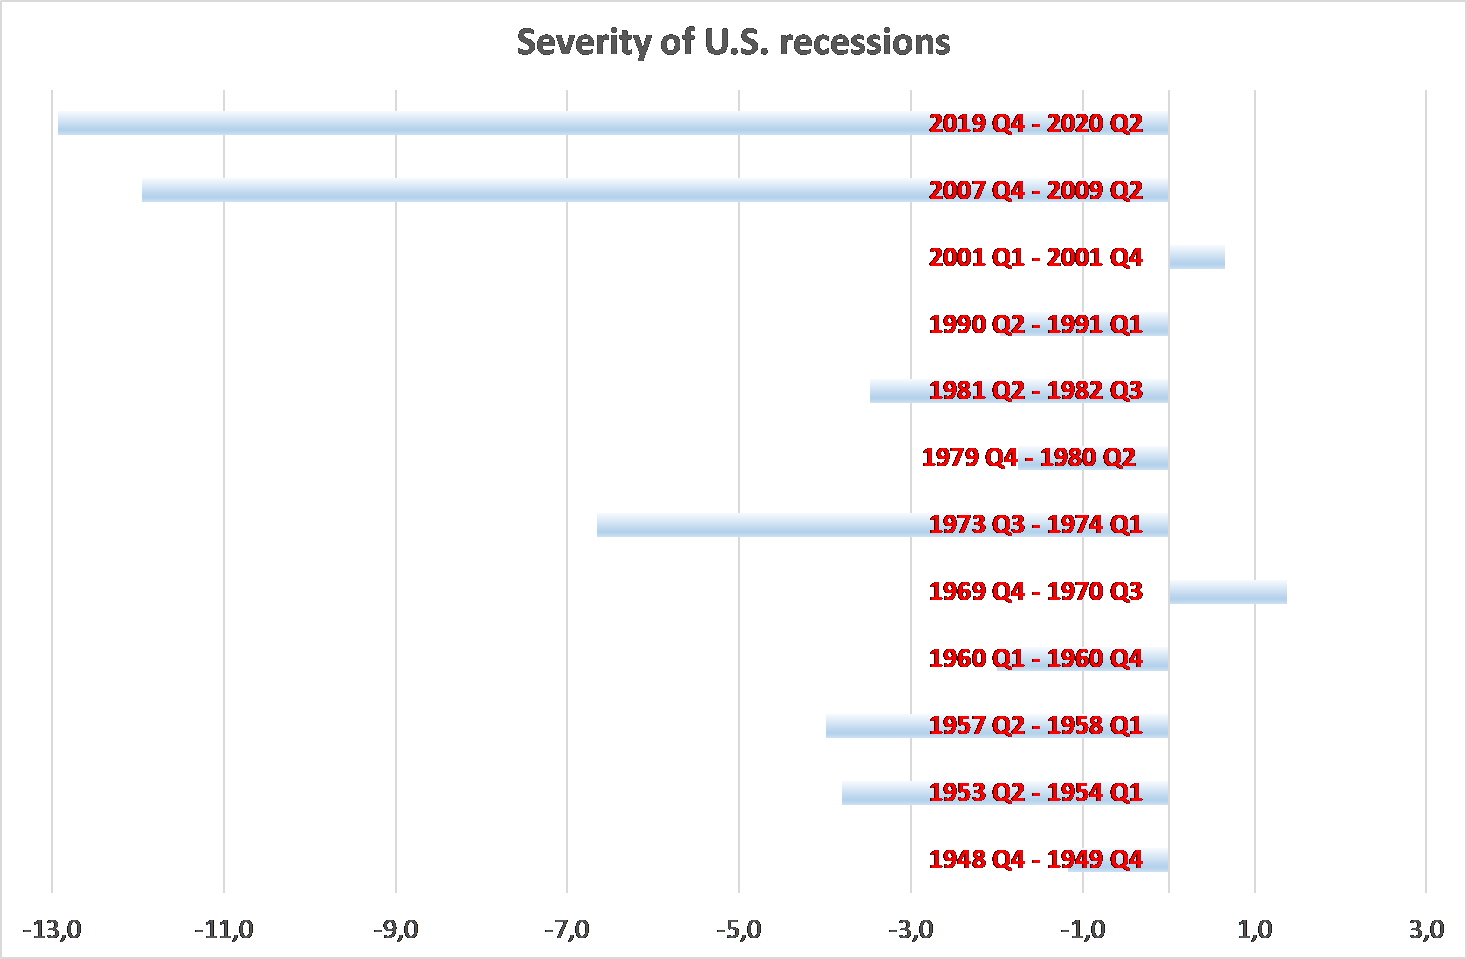 Source: NBER BCDC, Fred Database, CBO forecasts, author’s computations
This post written by Laurent Ferrara.
in explaining their rationale for picking February as the peak of the cycle, the NBER Business Cycle Dating Committee says:
“The committee believes that the two most reliable comprehensive estimates of aggregate production are the quarterly estimates of real Gross Domestic Product (GDP) and of real Gross Domestic Income (GDI), both produced by the Bureau of Economic Analysis (BEA). These measures estimate production that occurred over an entire quarter and are not available monthly. “
that’s not true; the monthly GDP data is released and revised with each GDP report. go to https://www.bea.gov/data/gdp/gross-domestic-product and select the “Key source data and assumptions” excel file. that file has the monthly data for each quarterly metric that goes into GDP, often as source date first, then as converted to NIPA metrics. they don’t compute monthly GDP, but with a little tedious math, someone at the NBER certainly could have done that themselves…
I have a very naive question. Severity is measured as amplitude * duration / 2. That makes sense, but why is duration peak to trough instead of date of peak to date that the economy returned to the peak? One would think that a slow recovery is more severe than one with a rapid recovery, all else being constant. If my sales drop 50%, then recover 10%, I’m still looking at a business that is down 45% from the peak.
Gord Gray: Well, that’s reasonable, except that approach is more sensitive I think to the underlying trend in GDP and all other macro-aggregates being watched.
We already discuss the characteristics of recoveries relative to their start, i.e., the trough, with very little if any reference to how we got there. ISTR 6 or 7 years in which we discussed why the recovery from the Great Recession was so slow for most people ( not complaining; it was a propos to the situation) and what could be done to speed it up.
I kinda like having a metric for how far and how fast we fell. We talk about causes of a recession because it bears on the remedies for it, but we lack any precise and generalizable language for our route to the trough. Perhaps we need a similar yet distinct metric for our journey to the crest.
I can see how recovery would be hard to measure. When did we finish recovering and start growing again? When we reached the previous GDP? GDP in constant dollars? GDP per capita in constant dollars? GDP per capita in constant dollars grows to where it would have been given a decade of average growth rate?
(I’ve always been confused why GDP is ‘the’ number instead of GDP per capita. If the population grows at 1% and the GDP grows at 1%, was there actually any growth?)
The point you raise applies to a good many summary measures of performance. Using a single measure to represent a complex situation necessarily leaves out detail. Those who complain about core inflation measures miss the fact that an additional summary measure provides additional information.
It is certainly true that the time needed to return to the prior peak in output, or to trend, is a good representation of welfare loss. Many discussions of economic cycles do include mention of the time needed to recover the prior peak.
As to the focus on GDP instead of GDP per capita, there is growth represented in total GDP – growth in gross output. Labor is an input to production, so in a crude sense, GPD per capita would be a ratio of output to one input (actually output to consumers of output). It is simpler to begin from GDP and work to per capita GDP than the other way around.