In progress, but incomplete.
At a monthly frequency:

Figure 1: Wisconsin coincident index (black), nonfarm payroll employment (teal), and civilian employment (red), all in logs, 2020M02=0. Source: Philadelphia Fed, BLS via FRED and author’s calculations.
Wisconsin nonfarm payroll employment is 4.8% below NBER peak in 2020M02, civilian employment 0.6% and coincident index is 0.9% (all in log terms). As noted elsewhere, the establishment survey based series is probably more reliable than the household. While NFP employment is down, the source of the shortfall is unlikely to be due to enhanced unemployment benefits, as discussed in this post.
At a quarterly frequency, we have 2020Q4 Wisconsin GDP 3.0% below the NBER peak in 2019Q4, while personal income excluding current transfers is 0.7% below.

Figure 2: Wisconsin coincident index (black), nonfarm payroll employment (teal), and civilian employment (red), advance GDP in Ch.2012$ (purple), personal income excluding current transfers in Ch.2012$ (salmon), all in logs, 2019Q4=0. Personal income deflated using US personal consumption expenditure implicit deflator. 2021Q2 employment values are for April only. Source: Philadelphia Fed, BEA, BLS via FRED and author’s calculations.
In terms of the coincident index, Wisconsin is doing better than the nation on average (down from peak 0.9% vs. 3.8%, in log terms).
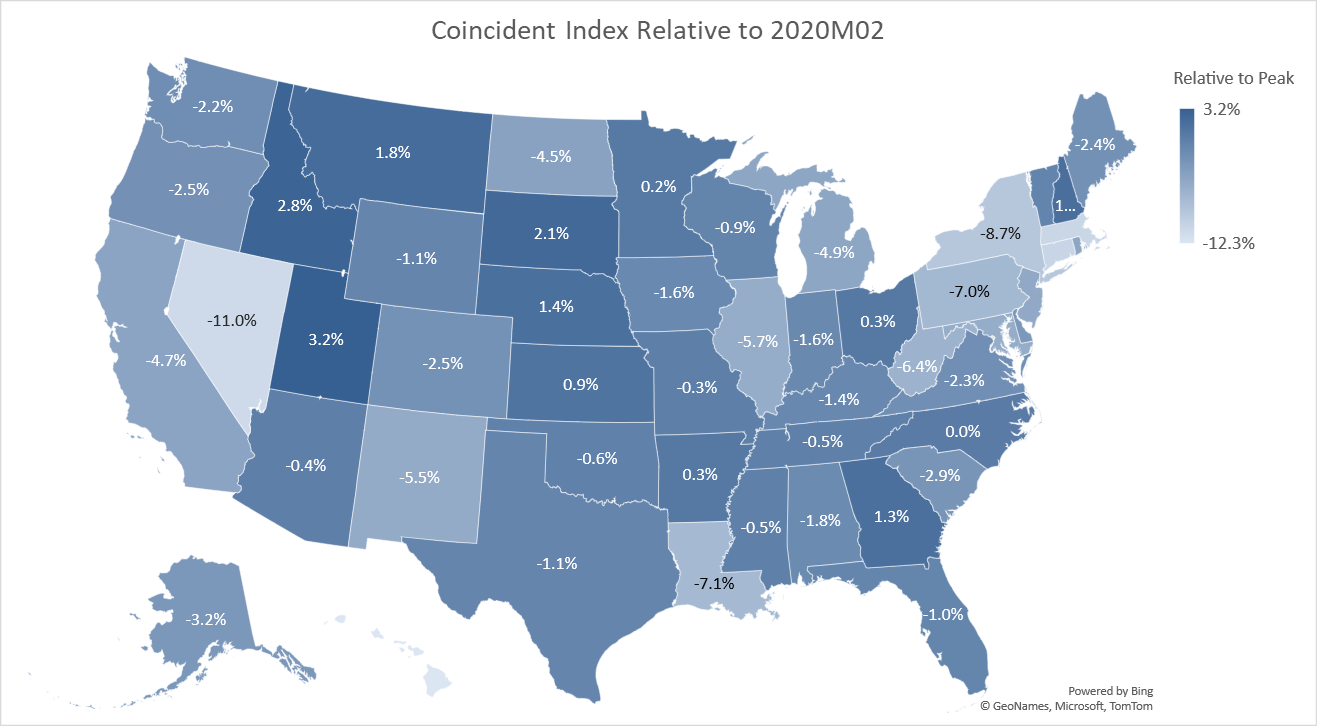
Figure 3: April state coincident index relative to February 2020. Source: Philadelphia Fed and author’s calculations.
Post a map with state area sized for population.
If you’re talking about person per capita it’s not terribly hard to find. Damn man, that’s worse than most the stuff I pester him for.