How are wages moving in Wisconsin, relative to the cost of living (as measured by the CPI)? It’s hard to tell.
BLS reports average hourly earnings for Wisconsin, but not for Wisconsin. Rather, as noted here, BLS reports the CPI for the Midwest Region, and the East North Central Division of the Midwest Region (see discussion in this post). I plot earnings and CPI, normalized to NBER peak at 2020M02:
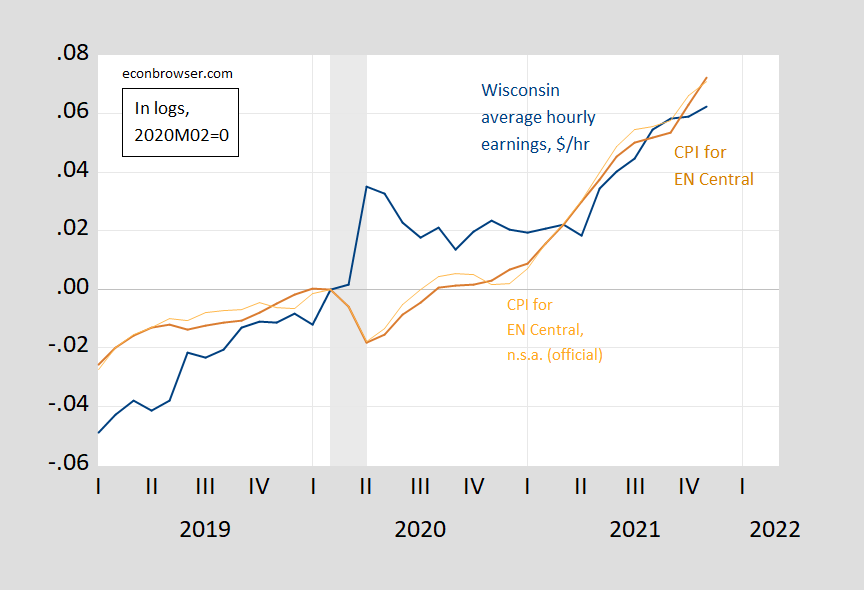
Figure 1: Average hourly earnings of all workers in the Wisconsin private sector (blue), and CPI-all urban for East North Central Division of the Midwest Region, seasonally adjusted using Census X12 by author (brown), and corresponding not seasonally adjusted official BLS series (light brown), all in logs, 2020M02=0. NBER defined recession dates peak-to-trough shaded gray. Source: BLS, NBER, and author’s calculations.
The cost of living has risen faster than average earnings. This stands in contrast to the national figures:
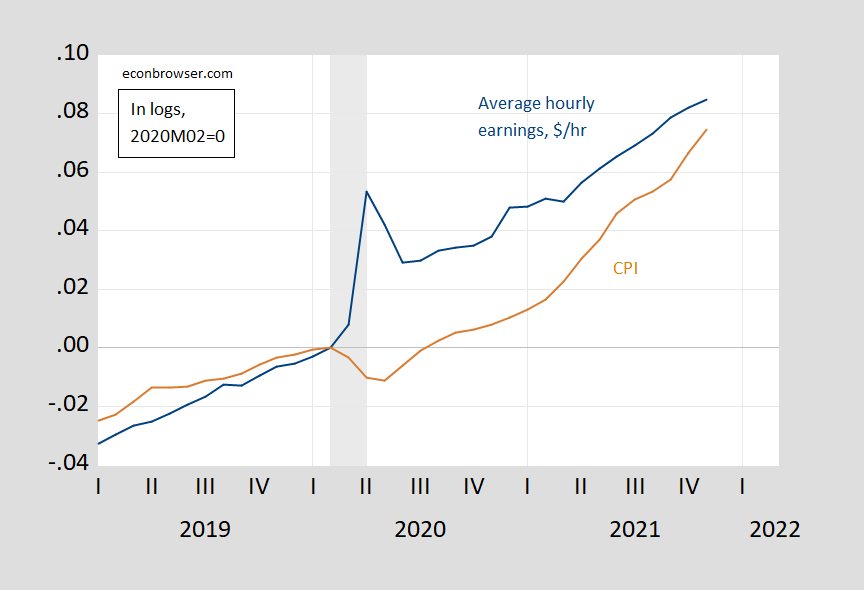
Figure 2: Average hourly earnings of all workers in the US private sector (blue), and CPI-all urban for for the US (brown) all in logs, 2020M02=0. NBER defined recession dates peak-to-trough shaded gray. Source: BLS, NBER, and author’s calculations.
Why has the CPI for the Midwest risen faster than for the nation as a whole? (year-on-year inflation for East North Central comprising Illinois, Indiana, Michigan, Ohio, and Wisconsin is about the same as that for the Midwest as a whole.). Two items stand out — Food and housing costs are about a percentage point higher in the Midwest — at 7.1% and 5.1% respectively — than in the nation as a whole. (Midwest CPI stats here.) The CPI weights for those two components (at the national level) are 14% and 42%.
One big problem with the comparison of average hourly earnings is that they don’t account for sectoral differences. I show below the evolution of average wages in Wisconsin manufacturing and in leisure and hospitality services. Clearly, in the latter case, wage growth has exceeded the growth rate in the cost of living (not accounting for compositional changes).
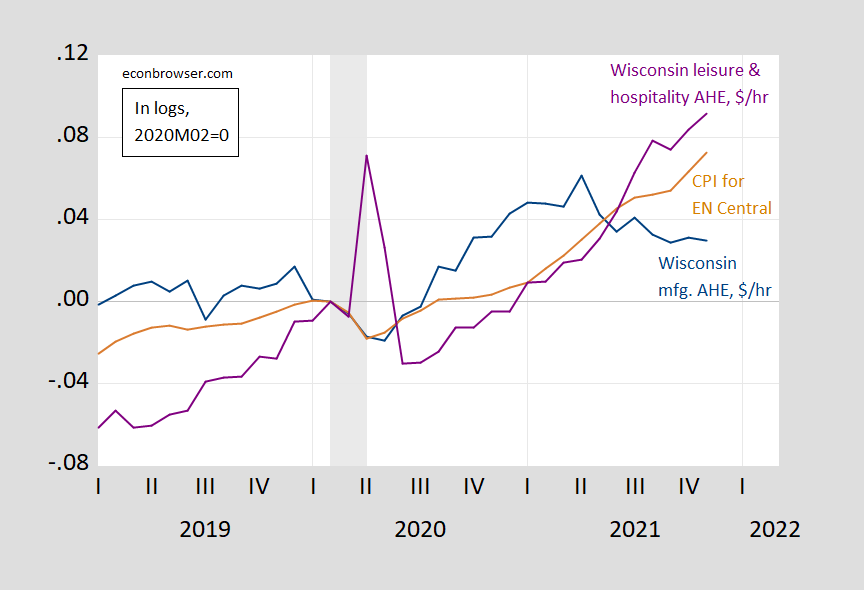
Figure 3: Average hourly earnings of all workers in the Wisconsin manufacturing (blue), and in leisure and hospitality services (purple), and CPI-all urban for East North Central Division of the Midwest Region, seasonally adjusted using Census X12 by author (brown), all in logs, 2020M02=0. NBER defined recession dates peak-to-trough shaded gray. Source: BLS, NBER, and author’s calculations.
It would be good to account for changes in the composition of the workforce. You can see that this is important at the national level by disaggregating, as one can if you slice the data using the Atlanta Fed wage tracker (which uses CPS data). Unfortunately, there is no equivalent adjustment at the state level.
The pending home sales numbers were down today. They seem to be slowing down which is what the forecasts were saying anyway. And if I am reading right (although the data seems semi-difficult to access) mortgage applications are still going down, which I guess is a “leading indicator” for the home sales.
I mean, I’ll confess to cherry-picking a little here, but isn’t housing usually one of the main drivers for inflation??
https://jabberwocking.com/for-inflation-doves-median-cpi-is-your-hot-ticket/
Kevin Drum’s latest must be written just to anger both the inflation hawks and rsm – median CPI inflation is only 3.5%!
what was median inflation in 1989, and was the item the same as today?
‘i was there’, in a firm which liked measures every month we met for hours, and discussed performance and looked for different measures to make thing look better….
in my misspent youth!
https://fred.stlouisfed.org/graph/?g=KmBe
January 15, 2018
Employment in Wisconsin, 2017-2021
(Indexed to 2017)
https://fred.stlouisfed.org/graph/?g=KmF1
January 15, 2018
Employment in Wisconsin and United States, 2017-2021
(Indexed to 2017)
Austin Goolsbee has an informative piece, “The Missing Data in the Inflation Debate.”
“With inflation growing at its fastest rate in decades, economists are locked in a debate over whether it stems from too much stimulus or from temporary, pandemic-induced supply-chain pressures. Less discussed are the ways that the pain of inflation may not be shared equally…The federal government breaks out detailed information on the growth of personal income for different groups and has the data to do the same with inflation rates, but it doesn’t…
Based on the national C.P.I., the government updates the poverty threshold each year to account for inflation. Columbia’s Center on Poverty and Social Policy has found that using a higher inflation rate that better reflected the consumer experience of low-income earners would have added more than three million people to the poverty rolls, an adjustment with major ramifications for domestic policy.”
https://www.nytimes.com/2021/12/30/opinion/inflation-economy-biden-inequality.html
It’s good to see that some are concerned about inequality enough to ask for more data and address the needs of low-income Americans.
JohnH: I agree, that is an excellent column. You might note that this issue has been discussed numerous times on this weblog, most recently in this post.
I heard some vague reference to this on the news but as usual the reporter failed to note that she got this information from Austin Goolsbee. Of course if a low income person spends more on things like food and transportation to work, increases in the relative prices of food and gasoline will mean a higher increase in the cost of living than is reported in the typical CPI inflation news.
But that reporting got me thinking about a project a few of us worked on when I was at Vanderbilt. Nashville in many ways is a lovely town but it turns out groceries cost less in high income neighborhoods than they do in poor income neighborhoods. And it turns out that the transportation system there was not exactly friendly to those without cars going shopping for food long distances. This is a form of price discrimination that would persist even all nominal prices rose at the same rate.
I say this because the tone of JohnH’s comment strikes me as his usual snide suggestion that economists rarely think about income inequality. Which of course is blatantly false.
Now that I was able to read his discussion, two things to note:
(1) While he notes reasons to believe there is this so called “inflation inequality”, he admits more research is needed before we make any strong conclusions;
(2) His discussion of how online shopping – which is not accessible to low income groups at least not yet – can help a household find better prices. We need to make the internet more accessible for this and a lot of other reasons.
Now this is an interesting paper on “Income Inequality”:
https://www.newyorkfed.org/medialibrary/media/research/staff_reports/sr173.pdf
Note it was written some 18 years ago by economists at the NY Fed.
Sorry – the paper was on “Inflation Inequality”.
There are two aspects of this 1983 paper of note. First the authors note they are building upon a lot of other research on what Goolsbee noted as “inflation inequality”. I get JohnH has to tell us economists do not care about these sort of things but economists have been considering these issues for decades. And then this from their abstract:
“Our results suggest that the inflation experiences of U.S. households vary significantly. Most of the differences can be traced to changes in the relative prices of education, health care, and gasoline. We find that cost of living increases are generally higher for the elderly, in large part because of their health care expenditures, and that the cost of living for poor households is most sensitive to (the historically large) fluctuations in gasoline prices. To our surprise, we also find that those households that experience high inflation in one year do not generally face high inflation in the next year. That is, we do not find much household specific persistence in inflation disparities.”
To take this to 2021 – it is true that the relative price of meat and the relative price of gasoline rose. So if you consume a lot of these goods, your cost of living many have risen by more than the official inflation rate. But suppose that the relative prices of these two goods fall in 2022 – this line about not seeing “household specific persistence in inflation disparities” would apply.
If you Google the journal of the American Economics Association on inequality and on interest rate, you get a ration of hits that’s 1:47.
That sounds like it’s a pretty good indication of where economists’ interests and priorities lie.
But pgl would have you believe that most economists think about inequality all the time!
Will pick up a hardcopy NYT tomorrow morning. Like to kind of “Reward” them when they do topics like this, and still like that old school crinkly paper. Never have to worry about a power outage on those, do yeh??
JohnH
December 30, 2021 at 3:09 pm
JohnH starts a good discussion but alas he decides to revert to this insane nonsense. Why? Because that is what he do. Sigh.
“The reason I say that is because of a recent paper by Broda and Romalis, who note that because of Chinese imports, lower income households have actually benefitted from globalization to a much greater degree than typically thought exactly because they have consumption patters skewed toward goods that have decreased in price over the past decade.”
From your earlier post. Their research confirms what a lot of people would expect. We import things like apparel and toys from China, which make up larger portions of low income household budgets. But I suspect quite a few of us dusted off Stopler-Samuelson to note that the impact on free trade has lowered low income wages more than it has lowered the prices of goods these household’s imported goods.
Which is to say looking at one aspect of what a policy change does is not exactly general equilibrium economics and may lead to misleading policy conclusions. Just saying.
https://www2.nber.org/conferences/2008/si2008/ITI/romalis.pdf
March 10, 2008
Inequality and Prices: Does China Benefit the Poor in America?
By Christian M. Broda and John Romalis
Abstract
Over the past three decades there has been a spectacular rise in income inequality as measured by official statistics. In this paper we revisit the distributional consequences of increased imports from China by looking at the compositional differences in the basket of goods consumed by the poor and the rich in America. Using household data on non-durable consumption between 1994 and 2005 we document that much of the rise of income inequality has been offset by a relative decline in the price index of the poor. By relaxing the standard assumptions underlying the representative agent framework we find that inflation for households in the lowest tenth percentile of income has been 6 percentage points smaller than inflation for the upper tenth percentile over this period. The lower inflation at low income levels can be explained by three factors: 1) The poor consume a higher share of non-durable goods —whose prices have fallen relative to services over this period; 2) the prices of the set of non-durable goods consumed by the poor has fallen relative to that of the rich; and 3) a higher proportion of the new goods are purchased by the poor. We examine the role played by Chinese exports in explaining the lower inflation of the poor. Since Chinese exports are concentrated in low-quality non-durable products that are heavily purchased by poorer Americans, we find that about one third of the relative price drops faced by the poor are associated with rising Chinese imports.
Interesting research that does not contradict my point:
“By relaxing the standard assumptions underlying the representative agent framework we find that inflation for households in the lowest tenth percentile of income has been 6 percentage points smaller than inflation for the upper tenth percentile over this period.”
And if the wage rate was negatively impacted by more than 6% (entirely plausible assumption) then their real wages still fell.
https://www.nytimes.com/2021/12/30/opinion/inflation-economy-biden-inequality.html
December 30, 2021
The Missing Data in the Inflation Debate
By Austan Goolsbee
The pain associated with inflation may be the most acute for those at the bottom. From mid-2019 to early 2020, the Consumer Expenditure Survey, the government’s primary data source on how consumers spend money, showed that those in the highest 20 percent of earnings spent, on average, less than two-thirds of their annual income. Households among the lowest 40 percent of earners actually spent more than their annual income, meaning they are most likely dipping into savings or taking out loans (although inflation can reduce the burden of debt for borrowers). Even at the same inflation rate, rising prices pinch spenders more.
Online shopping is also surely exacerbating inflation inequality. Before the Covid pandemic, I helped Adobe Analytics create a measure of online inflation analogous to the government’s Consumer Price Index (C.P.I.). Using anonymized data from Adobe’s marketing analytics division, we examined more than one trillion online transactions made between 2014 and 2017. We found annual online price inflation averaged almost 1.5 percentage points lower than the equivalent C.P.I.
Over the past 12 months, that gap has likely widened. Adobe’s latest release found online prices over that interval to be 3.5 percent higher — more than three full percentage points below the headline inflation rate of 6.8 percent. In November, online prices fell 0.2 percent as the C.P.I. rose 0.8 percent.
In other words: The more someone shops online rather than in stores, the less inflation the individual has faced. Notably, shopping online is far more common among high-income people. And during the pandemic the practice has grown more prevalent. Digital Commerce 360, a research company, estimates that three-quarters of the growth in the retail business in the United States in 2020 came from e-commerce.
In recent years, prominent economists from Harvard Business School, the University of Chicago, the Federal Reserve Bank of Chicago and the London School of Economics conducted studies with industry data on consumer shopping to compute personal inflation rates. They each found that lower-income earners may face inflation rates higher than top earners do….
“They each found that lower-income earners may face inflation rates higher than top earners do….”
I provided another link to his full discussion. He provided a link to an excellent 1983 paper (I have noted this paper in other comments) and ended the discussion with the possible caveat that this conclusion may not come through if we look at the data over a longer period of time. After all inflation inequality is all about relative price changes that may have adversely impacted low income households for THIS year. But one needs to look at these issues for a longer period of time.
https://en.wikipedia.org/wiki/The_Poor_Pay_More
The Poor Pay More is a 1967 book published by David Caplovitz. It is a sociology study of what could be called the “poverty penalty”, which is a concept that poor people pay more for the same goods and services as people with more money do.
[ Trade has significantly limited the poverty penalty over time, and will increasingly do so if allowed. ]
Has trade ended the poverty penalty? I would hope people might revisit the poorer neighborhoods of Nashville that were paying a lot more for groceries when I lived there.
This sound like an interesting book even if it written decades ago. I found this more recent reference:
E. Mierzwinski, E. “Colston E. Warne Lecture: Consumer Protection 2.0-Protecting Consumers in the 21st Century”. Journal of Consumer Affairs (2010).
It argued that the poverty penalty was still relevant in 2010.
For the folks are refuse to pay the NYTimes to get such excellent discussions, here is another link:
https://mainrocknews.com/opinion-the-missing-data-in-the-inflation-debate/
I can’t even find if it’s in the Thursday or friday’s hardcopy, I assumed it was in friday’s but they don’t list it on either THursday or friday in the hardcopy edition. I”m not buying Friday’s until I know if the Goolsbee guest post is there or not. I hate buying Friday’s anyway because that’s when they put Brooks column in there and i normally intentionally avoid buying the paper when he’s in it.
Oh, look! Our blind squirrel finally found a nut.
Of course he lost his nuts when he complained there are more papers on interest rates and inequality. JohnH has literally millions of comments complaining that economists do not examine the connection between interest rates and inequality. Yes the blind squirrel is now chasing its own tail!
I wonder the extent to which composition is at the root of slower wage growth in Wisconsin’s factory sector. Lower wage factory jobs don’t migrate south. Higherwage jobs do.
Service jobs, in addition to often being less mobile, also present fewer opportunities for cost cutting when they are mobile, because service pay is lower.
Too bad none of Wisconsin’s Republican legislators aren’t migrating south for higher paying jobs. Maybe they feel being a pig feeding at the trough of “big government” isn’t so bad after all……
https://legis.wisconsin.gov/assembly/acc/media/1533/19-20_salary.pdf
“The way Stellmacher sees it, “Every time you add more choices for parents, that’s good, I guess, but it also undermines the economies of scale of the public school system.”
Pulling out a few students from several classrooms doesn’t reduce costs, he explains, because each class still needs a teacher, but it reduces the total amount of money available to educate those students.
Over the next few years, the fiscal impact on surrounding districts of a single independent charter school opening will be mitigated by the complex state equalization formula that seeks to even out money among districts. But in the long run, Stellmacher says, “Our state taxpayers are now financing two systems. There are more options, but there is also more cost. It’s prohibitive to serve kids because you don’t have those economies of scale.”
Heather DuBois Bourenane, Wisconsin Public Education Network | Photo by Joe Brusky
Heather DuBois Bourenane, Wisconsin Public Education Network | Photo by Joe Brusky
As charter authorizers and new charter schools proliferate, “We’ve created all these strange barriers and back doors that make it easy to manipulate the system for financial gain, or to push a political agenda, which I believe the 1776 curriculum clearly does,” says Bourenane of the Wisconsin Public Education Network.
She does not oppose putting more resources into charter schools that serve Native American students, and would embrace allocating additional funds to them, she says, “but to children who need those investments who will directly benefit from it — not, in this case, children who live nowhere near the reservation, have no connection whatsoever, and whose schools do not even intend to provide a rigorous education in that area as a subject.”
‘Buyer beware,’ she adds. ‘I just hope people know what they are getting into when they sign up for these schools, and how they divert money from the rest of the community.’ ”
https://wisconsinexaminer.com/2021/12/22/how-a-wisconsin-tribe-helped-launch-a-trump-approved-make-america-great-again-charter-school/
I guarantee you, if Wisconsin based journalists dig deep, there are connections between the people who “own” or “Administrate” this school, lobbyists gifts and campaign contributions, and the state legislators who voted to approve. Not to mention it is largely implied to serve “Native Americans” and the extra tax dollars are going to serve 80%+ suburban white kids (and that 80% is number on the low side, so as not to misrepresent the truth)
BTW, if Tony Evers was smart, he’d rail against this in a “Populist” fashion, and go around to the different communities where money is being siphoned off from other students, making them more aware how they are being robbed. But that’s what Republicans do. Democrats snore in their office wondering why Democrats never show up at the polls. Maybe he’s eating Pelosi’s favorite boutique ice cream, because as an “educator” getting on the soap box in rural areas is just too much to ask of a man of Mr. Evers’ “sophistication”.
I take it you are no fan of those “right to work” (for minimum wages) laws.
I believe those are mainly aimed at killing Unions and nullifies the requirement of Union membership fees (which are usually minuscule compared to what the Union member gets back long-term) —not directly related to minimum wage. As one might imagine, the term was coined by a member of AEI, and is one of the most oxymoronic phrases ever entered into the English language. A person cannot “work” on a nonliving wage~~which is what “right-to-work” laws ensure will indeed be the case.
There are anti-Union rules, which I was sort of mocking. Why do the Japanese automobile multinationals establish factories in the South? To avoid the UAW. OK, they pay more than minimum wages but not exactly a whole lot more. I did not know the term came from an AEI type. Do you know who this AEI clown is?
Oh, I messed up. That’s what I get for reading Wiki pages too fast. It was actually Dallas Morning News editorial writer William Ruggles. My apologies. Here is an AEI page which discusses it.
https://www.aei.org/carpe-diem/dallas-morning-news-editorial-writer-william-ruggles-coined-the-term-right-to-work-on-labor-day-in-1941/
Rest assured that’s the first time and the last time you’ll see me using AEI as a reference source. I’m surprised AEI hasn’t given him a large statue for managing to con 75%+ of voting Americans with this intentionally misleading phrase, which Republican state lawmakers were happy to misuse in voting questions and our great “liberal”” media was gleefully happy to parrot.
Moses Herzog
December 30, 2021 at 2:10 pm
Much appreciated. Abusing Labor Day to promote a Constitutional Amendment to screw labor – wow!
I love his empirical “work”. Employment rose in Texas because of its “right to work” law? Seriously? Try the discovery of oil and other factors like that. AEI quality research I guess.
Actually I messed up by not realizing that AEI “quality” paper was penned by Mark Perry. His noting that employment rose in Texas should have jarred my memory of Paul Krugman’s take on the Texas jobs juggernaut. Krugman offers a few competing hypothesis – none of which related to their ‘right to work’ laws. But Krugman does have a little fun with Mark Perry’s general take:
https://krugman.blogs.nytimes.com/2011/07/18/texas-tales/
AEI is a rather mixed bag with some really awful ‘economists’. Mark Perry may be the absolute worse.
Thanks again Moses for this slice of history as well as the citing of Mark Perry’s latest spin.
I think it is a mistake to fixate too much on short term inflation in prices and wages. This is going to be a dynamic situation and things that look certain now may look quite different in a few months as employees with longer term contracts start to catch up with price increases. I think the more important metrics are 12 month inflation and trailing 2-3 month inflation. The former will factor in the overall economic well-being of households, and the near term inflation on their perceptions of whether things are improving or getting worse. And what’s really going to matter is the inflation rate after, say, July 1, because those rates will influence how people vote in November.
Steven Kopits: Well, in the post you commented on, I did present month-on-month inflation rates. You can look at m/m wage growth rate yourself (it’s easy to get on FRED) to see if you discern much.
Now, now – he may be inconsistent as it gets. But I think he may have a wee point here. See the 1983 paper Goolsbee linked and I put in the comment section.
To be fair – we do need to closely study these things and not have Princeton Steve’s naive application of his perfect markets hypothesis.
This New Jerseyite with the comatose cerebrum, wouldn’t be half as annoying as he is, if he didn’t contradict his own complaints, every three comment threads.
Wait – I thought Stevie deserted Princeton for Massachuetts place where only the Republican high rollers are allowed to live. No wonder he has to pay so much for bagels!
It appears on this particular topic (perhaps because I try to put Kopits out of mind as much as possible) your memory has proved better than mine. I had forgot about his mention of Cape Cod. Somehow Kopits going to Cape Cod makes me think of when Godzilla attacked NYC in the 1998 version of Godzilla. It was the most painfully bad Godzilla movie I have ever watched, with 1967’s “Son of Godzilla” a close 2nd. Let’s hope Kopits doesn’t have lots of little Kopitszilla babies ravaging the Massachusetts coastline.
Nothing wrong with posting it, I just wouldn’t read too much into it. Hospitality workers are often min wage unskilled, and they can change jobs fast, so their wages may reset faster than skilled manufacturing employees who may be subject to collective bargaining agreements set when inflation was low. The change in unskilled wages is likely to settle back to closer to CPI, while manufacturing wages are likely to catch up to inflation as contracts are renegotiated. So, I think the statistics are showing what we would expect to see in the short run, but six months from now, the story might be quite different, I think.
@ “Princeton”Kopits
When will oil hit $100 since it missed your first target date??
“I think it is a mistake to fixate too much on short term inflation in prices and wages.”
In principle, I would say this is a good point. But the economists noted in this discussion are smart enough to look at relative prices over a longer period of time. I trust their research as opposed to your “religion”.
The long run is a bunch of short runs. If you don’t know what happened over a series of short periods, you can end up mssing what caused the long run result. Ignoring the short run leaves you making a bunch of unnecessary assumptions about what happened on the way to the long run.
“Fixate” is just a word used to dismiss attention to detail.
In general, I tend to focus on data that relates to action. What action would you take? I would take no action, because I believe wages will catch up to inflation — that’s virtually one definition of inflation as opposed to price increases. So, in my opinion, we are seeing short term imbalances which are self-correcting. At this time, no action is required other than getting inflation more broadly under control. I would not therefore fixate on this data, just as I would not fixate on it being dark outside at 4 am.
But if you feel there are policy interventions required, go ahead and list them.
“I tend to focus on data that relates to action. What action would you take?”
Seriously? And we thought Trump was a pompous rear end.
Your data that said oil would hit $100 before the end of trading today sure was dead on. Brent is at $78, so if you can get a 28% rise this afternoon you’ll have nailed it.
In general, I focus on data that leads to understanding. That leads to less error when taking action. Just reaching for data that you have bothered to understand can lead to some pretty messed up decisions.
Think back to all the times Menzie has had to set you straight. You’ve told yourself you have understood, but haven’t.
https://news.cgtn.com/news/2021-12-30/Chinese-mainland-records-207-confirmed-COVID-19-cases-16pgUZA1sgo/index.html
December 30, 2021
Chinese mainland reports 207 new COVID-19 cases
The Chinese mainland recorded 207 confirmed COVID-19 cases on Wednesday, with 156 linked to local transmissions and 51 from overseas, data from the National Health Commission showed on Thursday.
A total of 27 new asymptomatic cases were also recorded, and 507 asymptomatic patients remain under medical observation.
Confirmed cases on the Chinese mainland now total 101,890, with the death toll remaining unchanged at 4,636 since January.
Chinese mainland new locally transmitted cases
https://news.cgtn.com/news/2021-12-30/Chinese-mainland-records-207-confirmed-COVID-19-cases-16pgUZA1sgo/img/7fbd1623616d49e39c0428c41f6bf954/7fbd1623616d49e39c0428c41f6bf954.jpeg
Chinese mainland new imported cases
https://news.cgtn.com/news/2021-12-30/Chinese-mainland-records-207-confirmed-COVID-19-cases-16pgUZA1sgo/img/a49d967d6ebb42e3bb495e8e699c4457/a49d967d6ebb42e3bb495e8e699c4457.jpeg
Chinese mainland new asymptomatic cases
https://news.cgtn.com/news/2021-12-30/Chinese-mainland-records-207-confirmed-COVID-19-cases-16pgUZA1sgo/img/082bdd43998a45f79d7f416400f0a0ad/082bdd43998a45f79d7f416400f0a0ad.jpeg
http://www.chinadaily.com.cn/a/202112/30/WS61cd57cba310cdd39bc7e56a.html
December 30, 2021
Over 2.8 bln COVID-19 vaccine doses administered on Chinese mainland
More than 2.8 billion COVID-19 vaccine doses had been administered on the Chinese mainland as of Wednesday, data from the National Health Commission showed.
https://www.worldometers.info/coronavirus/
December 29, 2021
Coronavirus
United States
Cases ( 54,656,866)
Deaths ( 844,272)
Deaths per million ( 2,529)
China
Cases ( 101,683)
Deaths ( 4,636)
Deaths per million ( 3)
Menzie,
Obviously there is a lot of short term noise here, but in trying to figure out why Wisconsin seems to have had a poorer real wage performance recently compared to the national numbers, it would seem that it is probably more coming from the wage side than the inflation side as looking at your post on regional inflation rates, Wisconsin looks to be kind of in the middle of the pack on that one. Probably hard to pin down any particular sector or sectors driving the wage result, although former Gov. Scott Walker famously shut down the public sector unions.
http://www.bls.gov/webapps/legacy/cpslutab5.htm
January 15, 2021
United States Union Membership Rates, 2020
United States ( 10.8)
Wisconsin ( 8.7)
https://fred.stlouisfed.org/graph/?g=KoSp
January 15, 2018
Average Hourly Earnings of All Private Employees in Wisconsin and Minnesota, 2017-2021
United States Union Membership Rates, 2020
United States ( 10.8)
Minnesota ( 15.8)
Wisconsin ( 8.7)
http://www.bls.gov/webapps/legacy/cpslutab5.htm
January 15, 2021
United States Union Membership Rates, 2020
United States ( 10.8)
Hawaii ( 23.7)
New York ( 22.0)
Rhode Island ( 17.8)
Alaska ( 17.7)
Washington ( 17.4)
Connecticut ( 17.1)
California ( 16.2)
Oregon ( 16.2)
New Jersey ( 16.1)
Minnesota ( 15.8)
Michigan ( 15.2)
Maine ( 14.7)
Illinois ( 14.3)
Pennsylvania ( 13.5)
Nevada ( 13.4)
Ohio ( 13.2)
Maryland ( 13.1)
Massachusetts ( 12.0)
Montana ( 12.0)
Vermont ( 11.8)
West Virginia ( 10.7)
New Hampshire ( 9.8)
Delaware ( 9.7)
Nebraska ( 9.6)
Missouri ( 9.4)
Kansas ( 8.9)
Wisconsin ( 8.7)
District of Columbia ( 8.6)
Indiana ( 8.3)
Alabama ( 8.0)
Wyoming ( 7.6)
Kentucky ( 7.5)
Colorado ( 7.4)
Mississippi ( 7.1)
New Mexico ( 7.1)
Iowa ( 6.6)
Florida ( 6.4)
North Dakota ( 6.2)
Oklahoma ( 6.0)
Louisiana ( 5.9)
Idaho ( 5.6)
Arizona ( 5.3)
Texas ( 4.9)
Arkansas ( 4.7)
Georgia ( 4.6)
Tennessee ( 4.4)
Virginia ( 4.4)
South Dakota ( 4.3)
Utah ( 3.7)
South Carolina ( 2.9)
North Carolina ( 2.3)
Robert Shiller spent a considerable time studying the long-term histories of several housing markets, coming to the conclusion that housing prices roughly tracked inflation over extended periods, and that seemingly the case for the American market from 1890 to about 1995. Then there came a change and housing prices have increased faster than inflation in the American market ever since, even with the “bubble” deflation after 2006. What puzzles me, then, is whether there really was a pattern to housing prices between 1890 and 1995… Shiller has not tried to explain.
https://fred.stlouisfed.org/graph/?g=rB5a
January 30, 2018
Case-Shiller Composite 10-City Real Home Price Index, 1992-2021
(Indexed to 1992)
https://fred.stlouisfed.org/graph/?g=mSzQ
January 30, 2018
Case-Shiller Composite 20-City Real Home Price Index, 2000-2021
(Indexed to 2000)
https://fred.stlouisfed.org/graph/?g=shSe
January 30, 2018
Homeownership Rate for the United States, 2000-2021
https://fred.stlouisfed.org/graph/?g=txCu
January 30, 2018
Homeownership Rate for White, Black and Hispanic, 2007-2021
First, aren’t your confidence intervals so wide as to make this noise?
Second, are you making up just-so stories about noise, to get attention? Is the mathematico-economic mumbo jumbo the equivalent of hand-waving?
Speaking of trying to get attention – your 15 minutes of fame expired months ago. Run away little troll.
rsm,
Oh, the entire blog is “just so stoties…to get attenton” even when it is not about noise. So, do you recommend it be shut down? If it such a waste of time, why are you showing up here? Maybe just to get attention?
I have suggested rsm start his own blog – one which just about everyone on the planet will ignore.
MSNBC and a lot of the other news organizations have brought in the C team for reporters over the holidays so when I heard a report on the fact the unemployment claims were only 190 thousand last week, I thought the reporter had lost it when she said this was a “52 year low”. Yea – it was lower than any other report for the last 52 weeks – but 52 years? So I checked with FRED and this statistic is reported by to early 1967:
https://fred.stlouisfed.org/series/ICSA
And maybe her reporting was not off after all.
https://fred.stlouisfed.org/graph/?g=E6Hp
January 30, 2020
Share of Total Net Worth Held by Top 1%, Top 90 to 99% and Top 50 to 90%, 2020-2021
https://fred.stlouisfed.org/graph/?g=E6cy
January 30, 2020
Share of Total Net Worth Held by Top 1%, Top 90 to 99% and Top 50 to 90%, 2020-2021
(Indexed to 2020)
https://news.cgtn.com/news/2022-01-01/Chinese-mainland-records-231-confirmed-COVID-19-cases-16sAXEfzULC/index.html
January 1, 2021
Chinese mainland reports 231 new COVID-19 cases
The Chinese mainland recorded 231 confirmed COVID-19 cases on Friday, with 175 linked to local transmissions and 56 from overseas, data from the National Health Commission showed on Saturday.
A total of 38 new asymptomatic cases were also recorded, and 514 asymptomatic patients remain under medical observation.
Confirmed cases on the Chinese mainland now total 102,314, with the death toll remaining unchanged at 4,636 since January, 2021.
Chinese mainland new locally transmitted cases
https://news.cgtn.com/news/2022-01-01/Chinese-mainland-records-231-confirmed-COVID-19-cases-16sAXEfzULC/img/e8513c0c905c440cb5dc1ce526eca220/e8513c0c905c440cb5dc1ce526eca220.jpeg
Chinese mainland new imported cases
https://news.cgtn.com/news/2022-01-01/Chinese-mainland-records-231-confirmed-COVID-19-cases-16sAXEfzULC/img/c8ec46f768734a558384d99c42cfd415/c8ec46f768734a558384d99c42cfd415.jpeg
Chinese mainland new asymptomatic cases
https://news.cgtn.com/news/2022-01-01/Chinese-mainland-records-231-confirmed-COVID-19-cases-16sAXEfzULC/img/a2f04b19fbcd4b35be2a936ccfd232b6/a2f04b19fbcd4b35be2a936ccfd232b6.jpeg