In the wake of the employment situation and monthly GDP (IHS Markit) releases:
The conventional picture, with GDP (BEA), normalized to 2021M11:

Figure 1: Nonfarm payroll employment (dark blue), civilian employment (orange), industrial production (red), personal income excluding transfers in Ch.2012$ (green), manufacturing and trade sales in Ch.2012$ (black), consumption in Ch.2012$ (light blue), and monthly GDP in Ch.2012$ (pink), official GDP (blue bars), all log normalized to 2021M11=0. Lilac shading denotes dates associated with a hypothetical recession in H1. Source: BLS, Federal Reserve, BEA, via FRED, IHS Markit (nee Macroeconomic Advisers) (9/1/2022 release), and author’s calculations.
An alternative picture, using implied benchmarked nonfarmpayroll employment, and GDO:
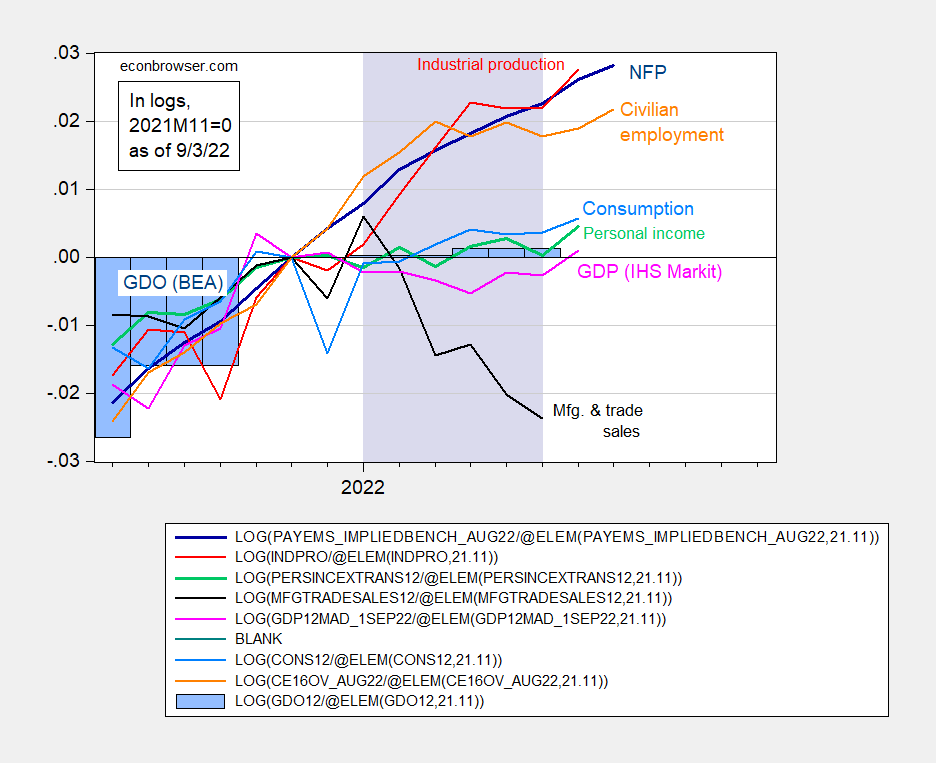
Figure 2: Nonfarm payroll employment (dark blue), civilian employment (orange), industrial production (red), personal income excluding transfers in Ch.2012$ (green), manufacturing and trade sales in Ch.2012$ (black), consumption in Ch.2012$ (light blue), and monthly GDP in Ch.2012$ (pink), official Gross Domestic Output (blue bars), all log normalized to 2021M11=0. Lilac shading denotes dates associated with a hypothetical recession in H1. Source: BLS, Federal Reserve, BEA, via FRED, IHS Markit (nee Macroeconomic Advisers) (9/1/2022 release), and author’s calculations.
Since we have additional data regarding Q3, I thought it would be interesting to see what quarterly data imply:
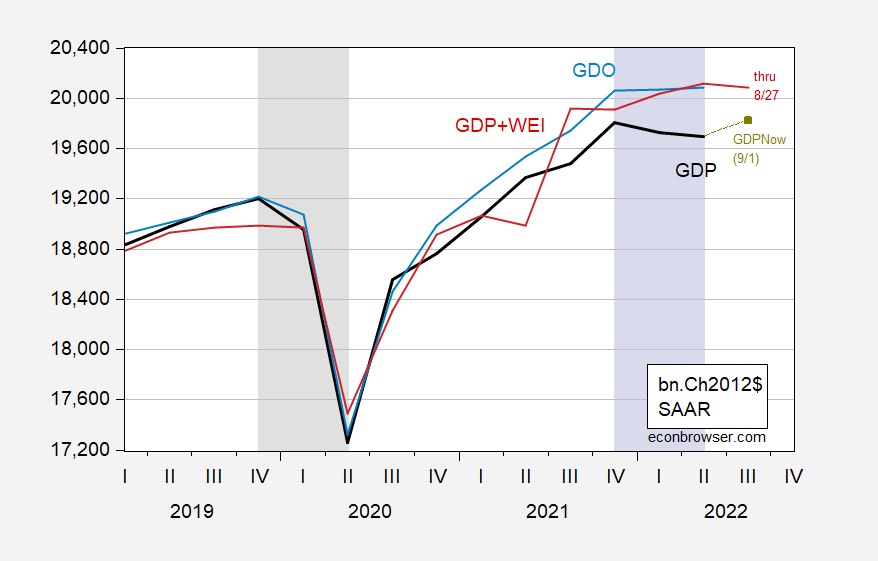
Figure 3: GDP (bold black), GDPNow implied level as of 9/1 (chartreuse square), GDO (light blue), and GDP implied by Weekly Economic Index (WEI) applied to year-ago GDP (red), all in billions Ch.2012$ SAAR, on log scale. Q3 for implied GDP uses WEI through 8/27. NBER defined peak-to-trough recession dates shaded gray. Lilac shading denotes dates associated with a hypothetical peak-to-trough recession in H1 as proposed by Steven Kopits. Source: BEA (2nd release), NY Fed via FRED (as of 9/3), Atlanta Fed (as of 9/1), NBER, and author’s calculations.
Notice that the implied level of GDP from the Lewis-Mertens-Stock Weekly Economic Index applied to GDP in 2021Q3 is pretty close to GDO for this and last quarter.
Addendum, 9:20AM Pacific:
None of the foregoing should be taken to imply I believe no recession is on the horizon. For instance, the Treasury yield curve has signaled a possible recession as early as April of this year, when the 2s10s went negative (although the 10s3m still haven’t as of a day-close data).

Figure 4: 10yr-3mo Treasury spread (blue) ,and 10yr-2yr spread (tan), both in %. Lilac shading denotes dates associated with a hypothetical recession in H1 as proposed by Steven Kopits. Source: Treasury via FRED, and author’s calculations.
Notice that a year ahead of H1, the yield curves were nowhere near inversion. On the other hand, many models have signaled negative growth in economic activity, as in these recent posts, by Stalla-Bourdillon, Ahmed, and others, and for recession, Natoli and Venditti, and myself.
It seems Princeton Steve has abandoned his RECESSION cheerleading. But no worries – his BFF JohnH will keep claiming the absurd.
This is a time when I really wish your co-blogger, Prof. Hamilton, would weigh in, because the recent rebound in several production and consumption metrics looks like it correlates with the downturn in gas prices since early June. What I used to call the “oil choke collar” tightened with the Ukraine invasion, and then relaxed once the situation stabilized.
For historical purposes, 15 years ago a professor polekatz (sp?) used to have a blog showing how well correlated Bush’s approval was with gas prices. This year the same has been true of Biden. It’s also correlated pretty well with consumer confidence measures.
One dark spot in the optimistic outlook: real sales. Including manufacturing, wholesale, and retail sales, they are negative YoY, which with only one exception (2019) has correlated perfectly with recessions for over 50 years.
I continue to believe a recession starts in about Q1 or Q2 of next year. The array of long leading indicators is now almost all negative (the only positive is that the short end of the yield curve (0-2 years) has not inverted), and housing specifically has worsened.
I’d like to comment about the official Unemployment numbers.
I think measuring “employment” as “payroll employment” can cause distortions based solely on new labor laws and regulation
Example: I have been “employed” by the same company (a sole proprietor/LLC) for more than four years now. For 3.5 of those years I was a 1099 “contractor”, which makes total sense, we work in TV/Film/Production/Events in Los Angeles — all the work is one project at a time, often on a tight schedule, then downtime between gigs. 1099 status for all let my employer hire in freelance labor on a per-project basis, and while he paid Workman’s comp and all Insurance and Overtime etc, he did not carry the overhead of having payroll employees.
When California AB5 was passed, I had to tell my employer about it, and press him to find out what that would mean for the business. His accountant said, “Don’t worry, it may never be enforced, might get struck down, for now do nothing.”
Well, this year my employer finally had to switch to using ADP to handle payroll. The change was 90% driven by insurance rates. His insurer quoted him a big rise in his annual comp/liability/etc insurance, but insuring through ADP would save him — quite a lot, almost 5% of his total revenue (business was down ~40% in the post-COVID world.) Adp would also help with any AB5 compliance that might happen.
So myself and a few other workers suddenly appeared in the “Payroll Employment” numbers, overnight, despite no change in the work we did, or business prospects. Although, my boss is cautious about taking on any large projects suddenly, due to uncertainty over how to “overhire” temporary skilled workers, even freelancers he has hired many times before. (Very few skilled people are available these days, as well.)
As AB5 enforcement bites, how many more people will be “hired” or “fired”? See the status of California truckers, for example.
I have to note that AB5 enforcement has been accompanied by increased pressure from Hollywood Unions, to eliminate any use of non-union labor even by any sub-contractor all down the chain. That is having an effect as well.
B
Might that help explain the difference between the payroll numbers and total employment, which flattened starting in March?
Our host has written extensively on this issue. Apparently you have not read anything he has written. BTW lying troll – BLS reported a 422 thousand increase last month. That is not flat.
OK, wise guy. The household survey “ Includes the unincorporated self-employed,” The employer survey does not. I assume that means that 1099 contractors would not be included in the employer survey and their shift to payroll in CA could help explain why one measure has been rising and the other almost flat.
https://www.bls.gov/web/empsit/ces_cps_trends.htm#concepts
Now, can pgl actually offer constructive criticism?
Macroduck has covered this. Pay attention troll. And this change is not the main difference. Unless you are accusing our host of lying.
“By the way, AB5 went into effect in 2020, so the difference in treatment of some 1099 contract workers between the CES and CPS probably doesn’t account for this year’s divergence between the two job counts.Gven everything else that was going on in 2020”
Take a look at Macroduck’s graph. The Household Survey in 2020 was showing faster growth than the Payroll Survey. Whoops. Now you were trying to explain why the Household Survey showed less growth than the Payroll Survey from March 2022 to July 2022 on something that did not change. How STUPID are you?
In response to some:
— Yes, AB5 was passed in 2020. But it has not been enforced at all until this year, as per an accountant’s advice to basically, “Ignore it. Until you can’t ignore it.”
— Other states and IIRC the Federal Govt are talking about adopting AB5-type laws or regulations. This has happened recently.
— I am unclear what the “household survey” encompasses. Nobody ever called me every month to see if I was self-employed, only info on my status would come from annual tax returns. I think it is possible that some of the recent 500,000 jump in payroll employment is sudden AB5 compliance.
Contract employment is counted in the Current Population Survey:
bls.gov/cps/
California’s AB5 should not change the number of employees counted each month, because 1099 contractors were already counted. It may lead to a reclassification, which is, after all, the intent of AB5.
By the way, AB5 went into effect in 2020, so the difference in treatment of some 1099 contract workers between the CES and CPS probably doesn’t account for this year’s divergence between the two job counts.Gven everything else that was going on in 2020, it would be hard to pick out the effect on national employment numbers of a classification change in a single state:
https://fred.stlouisfed.org/graph/?g=ToqX
And the magnitudes are all wrong. The monthly dfference between CES and CPS totals in California are too small to account for much of the difference in the national numbers:
https://fred.stlouisfed.org/graph/?g=Tot3
Excellent. California’s population may be 40 million but the nation’s is 330 million. So this calculation would be a mere 15% of the total. And as you also pointed out – the timing is all wrong for Johnny boy’s latest speculation. But hey Johnny boy also told EV readers that UK real wages benefitted from Cameron’s fiscal austerity. Yea – he never let facts get in the way of his rantings.
https://www.investopedia.com/california-assembly-bill-5-ab5-4773201
There is a lot more to this issue regarding AB 5 that I doubt JohnH is aware of. This link notes how certain companies have become exempt from AB 5. Now it would be an interesting paper suitable for the Journal of Labor Economics if someone actually did the real research on the impact of this law. My bet is that the number of workers who became employees rather than independent contractors is quite modest and certainly not what explains why two years after this law went into effect the payroll survey showed such a high increase.
And we know JohnH has done zero research on this topic. But hey – let’s ask this Economic Know Nothing and make a real attempt. After all getting a paper in the Journal of Labor Economics who be quite the coup.
Thanks for the qualification. It seems Johnny boy is still trying to tell us that employment has not been growing. Yea – he does not understand any of this stuff but what’s new.
Oh joy! JohnH is now mansplaining to us why this concern is so important. I really love it when a total village idiot mansplains labor economics to us!
Interesting. Thanks for sharing. Much of what you said is thought-provoking. I am very pro- labor Unions. But your comment reminds that there is another important side to that coin, with very hard-working people, which is also important. I am a former trucker, so this also caught my attention
Now….. what we really wanna know is, have you met any “cool” peoples like Quentin Tarantino or Paul Schrader. Please, no mentions of D-list Kathy Griffin types, only the cool ones you met.
Moses,
Speaking of drivers, unions and (sneaking a new subject in) supply chains, you probably know aboutthis:
https://www.businessinsider.com/ups-drivers-strike-contract-negotiation-teamsters-2022-8
UPS driver contracts expire next July. The new guy at the union is talking strike.
A few months ago I was afraid the USA dock workers were gonna muddle things up, but I haven’t revisited that bubbling cauldron in awhile. I just remember when I read it thinking it looked like a serious threat to USA supply chains, but maybe the PR issues made them back-off?? I was even kinda waving the red flag and firing the flare gun for Menzie to keep an eye on it, and he wisely seemed to brush it off.
https://www.investopedia.com/california-assembly-bill-5-ab5-4773201
An interesting discussion of whether AB 5 applies to California truckers.
I still think the Federal Reserve is playing with fire if they implement a 75 bps hike. Someone else on the blog seemed to think that maybe Powell was using severe language at Jackson Hole so the market would “do the dirty work for him” (my sloppy paraphrase of that commenter’s thoughts). I would find that theory very plausible, if only I thought Powell had that level of intelligence (I don’t).
Now is a time for moderate moves, and a pause to watch more data roll in.
Moses,
No need to rely on Powell’s cleverness. There’s a whole intellectual infrastructure at the Fed – institutional memory put to work – which keeps ideas like this one in front of policy makers. The FOMC minutes routinely include staff reporting on market reaction to Fed chatter and policy moves. Nobody is allowed to ignore market transmission of Fed policy.
Of the indicators used by NBER to determine the timing of business cycles, shown in figures 1 and 2, the worst performer is manufacturers and trade sales. The peak in those sales in March 2021 corresponds to the peak in real personal consumption of goods:
https://fred.stlouisfed.org/graph/?g=Tov8
The decline in real goods consumption is part of a rebalancing toward a more normal mix of goods and services consumption after the Covid recession. Service production does not, of course, show up in manufacturers and trade data. Goods consumption is more cyclical than services consumption, and NBER’s cycle-dating indices are chosen partly for their cyclical character.
Assuming U.S. consumers haven’t changed their preferences too very much since pre-Covid days, there is more rebalancing to come. That is likely to mean more weakness in manufacturers and trade sales. How NBER will take rebalancing into account is beyond me. Professors Chinn and Frankel are probably best qualified to speculate on that point.
More evidence that energy costs are taking a bite out of European output:
https://www.businessinsider.com/ups-drivers-strike-contract-negotiation-teamsters-2022-8
The fact of energy and water shortages in Europe is not news. What’s interesting as a student-level example of market decisions setting the marginal this equal to the marginal that is a tidbit about folks in the agricultural sector selling their energy supply contracts for big bucks. The expected decline in flower output is partly because selling energy contracts is more profitable than selling flowers.
Rats! And a thousand pardons. Wrong link:
https://www.bloomberg.com/news/articles/2022-09-02/energy-crisis-empties-greenhouses-in-world-s-top-flower-producer#xj4y7vzkg
Of topic, China ain’t what it once was –
Chinese banks are baulking at Beijing’s plan to stabilize the property sector. Beijing wants banks to take shakey loans onto their books without offering an explicit backstop in caseop of defaults. Paternalism tastes bad sometimes:
https://www.asiafinancial.com/china-banks-officials-resisting-beijings-property-rescue-call
Gotta find a trillion dollar somewhere…
This is an AWESOME website. Where/how did you find this!?!?!!? I keep expecting them to drop the paywall bullshit on me, but nothing yet.
Reasons for economic development
https://economics-dictionary.com/reasons-for-economic-development/