In the debate over whether the establishment survey nonfarm payroll employment series is seriously overestimating recent (particularly Q2) employment, a reader querulously asks “So you’re saying the Philly Fed screwed up its analysis and we should ignore its work? That’s your view?”. Short answer to first question: No. Short answer to the second question: see below.
I take a lead from the Chow-Lin approach to interpolating/extrapolating via related series, and exploit the close relationship between the overall movement in the total covered employment series in the Quarterly Census of Employment and Wages (QCEW) and the nonfarm payroll employment series. Specifically, I follow this procedure:
- Estimate the relationship between log NFP employment and log total covered employment, 2001-2019.
- Use this relationship to predict NFP employment, both in-sample and out-of-sample
- Verify that NFP employment is well predicted in out-of-sample period.
- Interpretation
In order to allow the statistically challenged to understand the procedure (for instance, people who don’t know what a confidence interval is), show what I do in steps.
- Estimation
I take data on NFP (FRED series PAYNSA) and QCEW total covered employment over the 2001-2022 period (QCEW data starts 2000M12). QCEW data are from a Census, and hence should not be subject to sampling error (QCEW data are used to benchmark update survey based estimates from the CES). Unfortunately, QCEW total covered employment are not reported in seasonally adjusted terms. Hence, I estimate the relationship between not-seasonally-adjusted series, in logs. These data are shown in Figure 1.
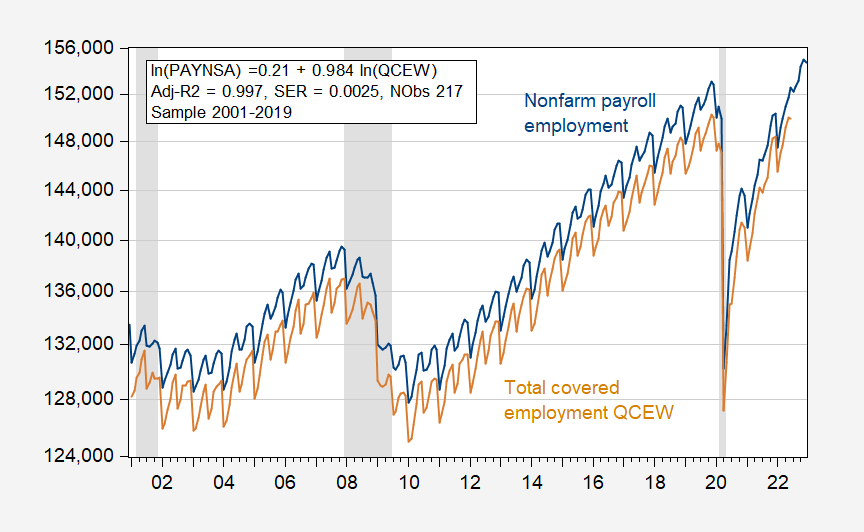
Figure 1: Nonfarm payroll employment (blue), total covered employment (tan), in 000’s, not seasonally adjusted. Nonfarm payroll series is FRED series PAYNSA; total covered series is BLS series ENUUS00010010. NBER defined peak-to-trough recession dates shaded gray. Source: BLS.
Note that the very high correlation. Running a regression (through 2019), the statistical fit is extremely good, with Adjusted R2 at 0.997.
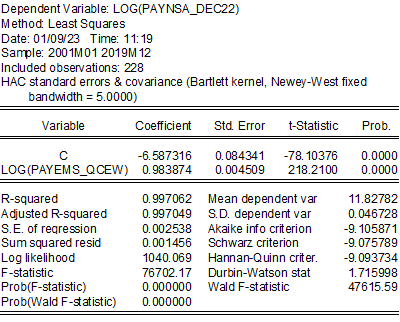
The constant is pretty small, and the coefficient is near (but significantly different) from unity. Nonetheless, we are interested in prediction, so this point is not of concern. To guard against spurious correlation, I test for cointegration using the Johansen maximum likelihood method. I reject the null of zero cointegrating vectors (constant, no trend in cointegrating vector) at the 10%.
Why not estimate over the full sample, up to 2022? This yields a similarly good fit.
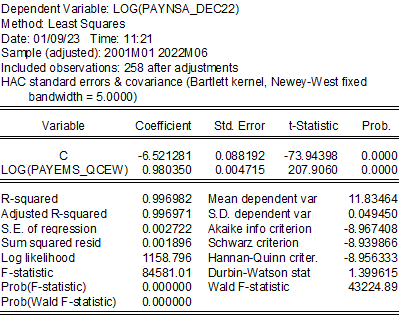
However, a test using recursive residuals to evaluate structural breaks indicates that there’s a break at 2020M07, supporting the use of a sample that ends before the pandemic’s onset; this is shown in Figure 2.
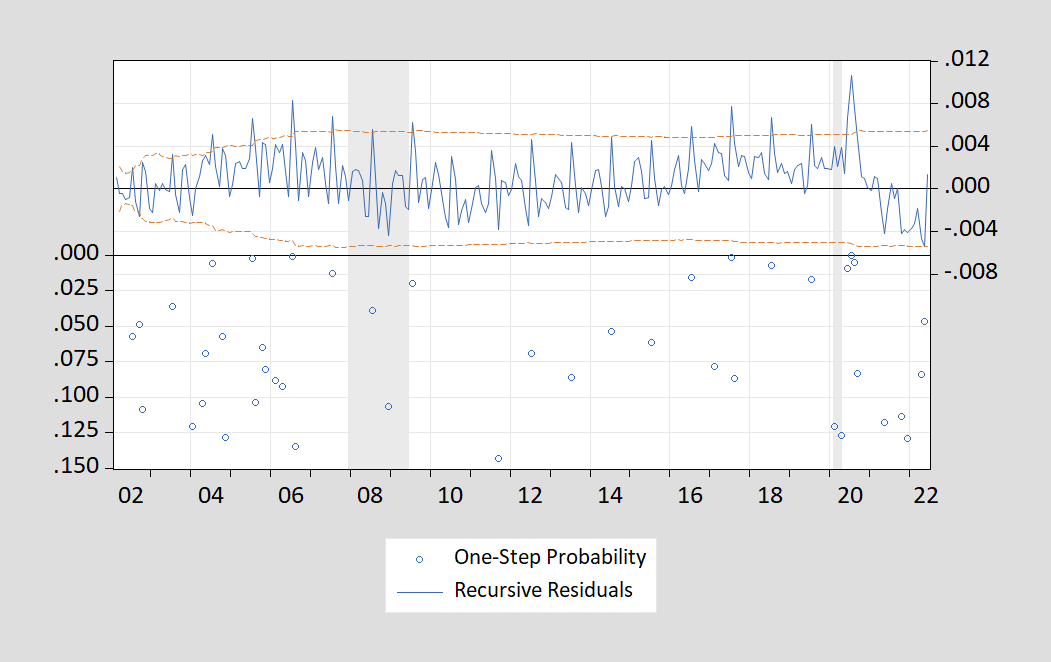
Figure 2: Recursive residuals from regression of log PAYNSA on log total covered QCEW employment. P-values on LHS scale.
- Prediction
I use the equation estimated over 2001-19 to predict not seasonally adjusted NFP (PAYNSA). This is shown in Figure 2.
The fitted tracks the reported series fairly well. This is to be expected as the BLS series is benchmark updated using QCEW data.
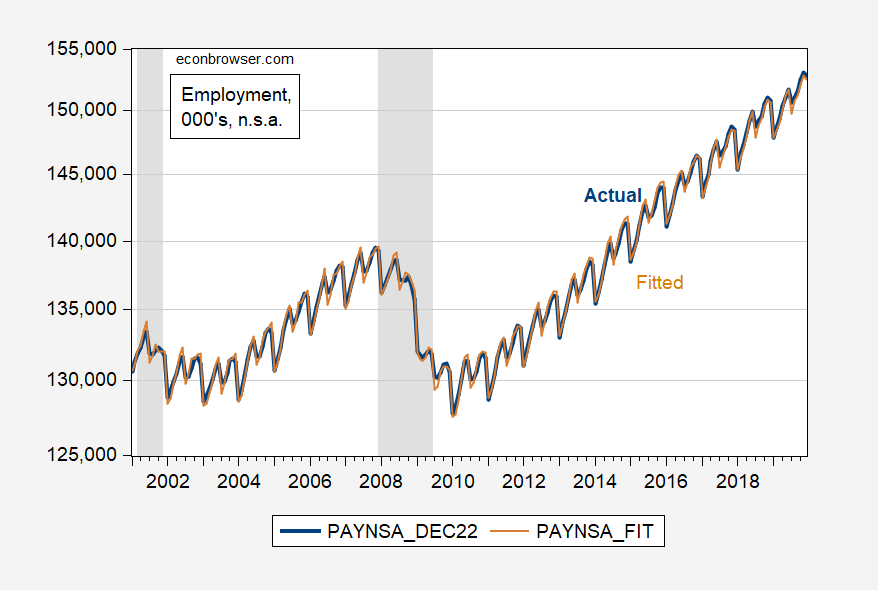
Figure 3: Reported nonfarm payroll employment, not seasonally adjusted (blue), fitted (tan). NBER defined peak-to-trough recession dates shaded gray. In-sample period shaded light green. Source: BLS, NBER, author’s calculations.
- Out of sample fit
The equation used to fit the model is estimated over a period ending at 2019M12. That means 2020-2022M06 is the out of sample period that can be assessed (since QCEW data ends at 2022M06). These predictions are shown in Figure 4. Green denotes the in-sample period.
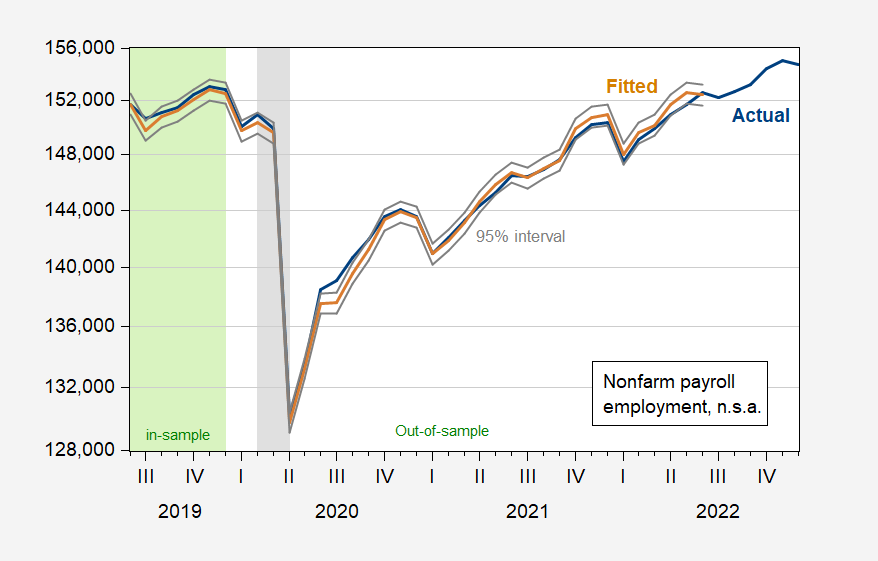
Figure 4: Reported nonfarm payroll employment, not seasonally adjusted (blue), fitted (tan),95% prediction interval (gray lines). NBER defined peak-to-trough recession dates shaded gray. In-sample period shaded light green. Source: BLS, NBER, author’s calculations.
In a period that spans the pandemic lockdown, the mean error is 50 thousand (remember NFP employment right now is about 153 million), maximum 1.9 million and minimum -866 thousand, standard deviation of 582 thousand.
- Implications for the Debate
Interestingly, in the post-sample period, the model tends to underpredict reported employment for the most part. In other words, if the historical correlations hold, then the implied NFP should actually been higher than what was reported. As of March, the NFP number should’ve been higher by 291 thousand; and as of June, reported NFP was 155 thousand over what was predicted, so it is only in June that we have some evidence of over-estimation. While reported NFP was above predicted, it’s a much smaller number than nearly 1 million predicted by Philadelphia Fed.
These are not seasonally adjusted series. In order to convert my predicted values to those compatible with the usual referenced seasonally adjusted series (PAYEMS), I add the seasonal component as estimated by the BLS (PAYEMS-PAYNSA) to the predicted values shown in Figure 4. I show this fitted series and the actual in Figure 5.
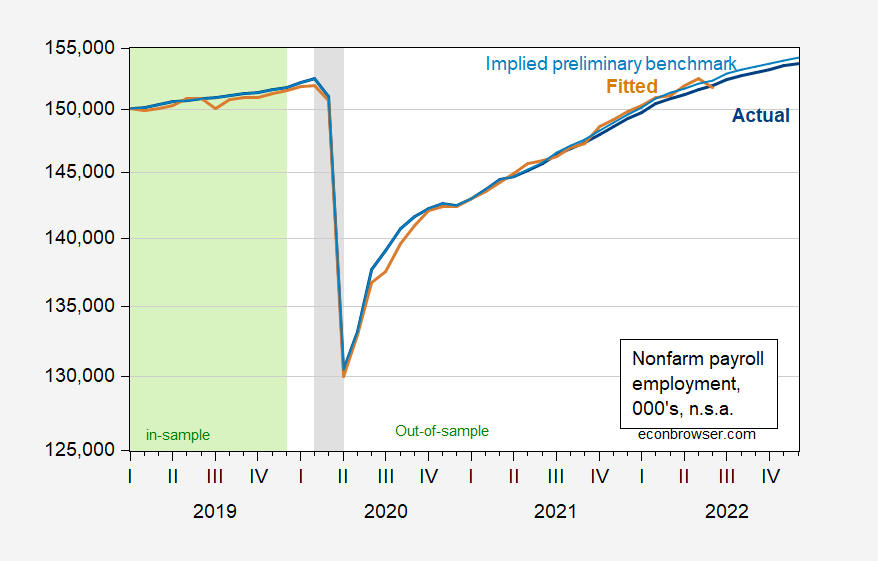
Figure 5: Reported nonfarm payroll employment, seasonally adjusted (blue), and fitted (tan), nonfarm payroll employment implied by preliminary benchmark revision (light blue), all in 000’s, s.a. NBER defined peak-to-trough recession dates shaded gray. In-sample period shaded light green. Implied benchmark revision series construction described in this post. Source: BLS, NBER, author’s calculations.
The fitted value of seasonally adjusted NFP is actually pretty close to the implied benchmark revision, calculated using the NFP numbers for March (sky blue line) — updated using QCEW and other data, so this is not too surprising.
I show a detail of the most recent data, along with the BLS research series adjusting the civilian employment (household survey) series to the NFP concept (green line), as well as the Philadelphia Fed’s adjustment of QCEW data to fit NFP (red squares), in Figure 6.
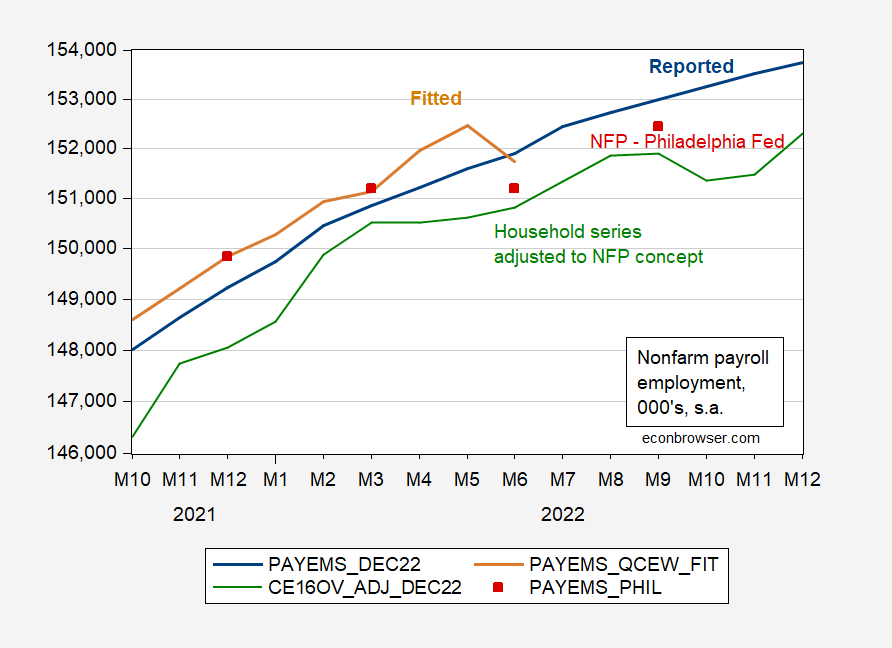
Figure 6: Reported nonfarm payroll employment, seasonally adjusted (blue), fitted (tan), BLS research series civilian employment adjusted to NFP concept (green), and Philadelphia Fed series (red squares), all in 000’s, s.a. NBER defined peak-to-trough recession dates shaded gray. Source: BLS, Philadelphia Fed, and author’s calculations.
My March figure for NFP closely matches the BLS series, both n.s.a. and s.a. (where I have used the BLS’s seasonal adjustments). My first observation is to note that this is a quick and dirty approach. It is not a wholesale defense of the benchmark un-revised series. Certainly there are reasons why the establishment series goes off track. In their “holistic” assessment, House and Pugliese/Wells Fargo highlighted the fact that the birth/death model could have been introducing too many new firms being created, thereby pushing up the NFP number. However, I am tracking using the QCEW, which is not subject to estimation error of this sort.
My second observation is that the fact that the Philadelphia Fed’s series implies a much lower NFP does not mean one or the other methodologies is wrong. It might mean that seasonal adjustment processes is distorting the results (either on the BLS side, or on the Philly Fed side, recalling how they are switching between geometric and additive errors), or the way the Philadelphia Fed reconciled state/sector data between the QCEW and the establishment survey imparted measurement error. Time will tell, in this case. I would never say ignore the Philadelphia Fed series; just consider alternative ways of looking at the data when evaluating the plausibility of the reported NFP series. Now, the civilian employment series consistently undershoots the official BLS series. Maybe it will turn out the household series is providing better signals about employment than the establishment and the Quarterly Census of Employment and Wages (remember it’s a census), but this is a little hard for me to understand, especially given the high variability of the household series (see this graph).
If the birth/death were over-estimating new firm birth or underestimating firm existing firm death, one might expect to see evidence from other sources that small firm employment is weak. Let’s take a look. According to ADP, over the 12 months to December, the smallest firms (1 to 19 workers) shed 194,000 jobs while the next category (20-49) added 1,095,000 jobs. Between the two categories, that’s a gain of 865,000 jobs. Keep in mind that firm growth can cause firms to shift size categories. I don’t know what the distribution of employment is across new firms. Some of them probably hire more than 49 people. Problem is, the next ADP size category is from 50 to 249, and the upper end seems high for most firm births. Anyhow, that category added 1,883,000 workers. The birth/death model added 1,341,000 in all of 2022 following 1,221,000 in 2021.
By the way, the NFIB survey ofits members (independent businesses) shows quite health labor depand throughout 2022, in agreement with ADP and the birth/death model.
So we have pretty solid evidence of health job growth among firms employing fewer than 50 worker, even healthier for firms gelow 250 workers. That’s much of the universe meant to be covered by the birth/death model. Doesn’t mean the model didn’t over-estimate job at new firms or under-estimate jobloss due to firms closing, but it is reason to think that, if there is an exaggeration of hiring in the model, it’s modest.
I appreciate this detailed explanation. It’s very edifying. I think it was unnecessary in the sense that there was no need to go further to prove the accuracy, trueness, and factuality of Professor Chinn’s prior assertions on the topic. But in the process of “calling out” Kopits, I feel it is helpful to people such as myself, who did not doubt Professor Chinn’s prior statements, but still found the “breakdown” of this post very educational and useful in connecting/relating all of the series of steps in the econometrics. So I am grateful for the effort Professor Chinn put into this post to help people like myself at the lower end of the learning scale, even if my suspicion is accurate that Kopits does not appreciate it, in the way that he should.
In short, Thanks Menzie.
Moses – I agree – thanks Menzie – there was a news report in which the BLS made a statement about this – they were looking at more comprehensive data and there can be differences in these data sets that get reconciled over time – etc but none of these will stop Sen Rick “Let’s dismantle Social Security” Scott and Fox News from trying to call Biden admin liars and hence we have various RW talking heads repeating Fox News disinformation (The election was stolen; Covid is just flu!; climate change is not real; the local Woodmans grocery is not offering hiring bonuses, etc.)
By the way – does anyone in media – remember when Republicans were constantly complaining during Obama years that regulations (!) were causing economic uncertainty (indeed I think Menzie did some posts about how it wasn’t true) – but every-time they get in charge with a Dem in White House they immediately start threatening to bring down the global financial order – so they can reduce your $125 SNAP benefit or make sure you work till you drop dead in a ditch https://news.yahoo.com/let-fight-now-over-us-161106323.html
@ James
: ) It’s a nice thing when people know the value, of showing appreciation to the work or words of others. Especially well-intentioned people. People will take your last sentence, related to SNAPS and “dropping dead” as some kind of “hyperbole”, I would like to say James. I don’t take your words as hyperbole, but rather , as I only guess you intended them, as solemn/sad reality.
God bless.
Off topic – Brad DeLong has changed his mind regarding U.S. relations with China.
I have long maintained that if I can predict what someone will say or write on a subject, they’re wasting my time. “Same old stuff. Heard ya last time.” It’s more useful to watch someone change their mind in respose to new information.* So, I note with interest that Brad DeLong has changed his mind about how the U.S. should deal with China:
https://braddelong.substack.com/p/welcome-to-e-new-cold-war-thunderdome
DeLong served as a Deputy Assistant to the Treasury Secretary in the Clinton administration, which worked to help China to join the WTO, on the theory that trade liberalization would lead to a more liberal China in general. China’s behavior under Xi has convinced DeLong that China must now be confronted and deterred.
*”When the facts change, I change my mind. What do you do, sir?”
— Attributed to J. M. Keynes
I would say that I have been saying this~~that the Chinese only respect strength, power, and ability to induce fear, for roughly the last 15+ years, and not (I don’t think) because I have any grudge against China. But that would sound arrogant and self-aggrandizing, aye?? I may have a few grudges here and there, but I have tried to keep that separate from my geo-political thoughts on the nation. And actually….. I believe…… I have largely succeeded (for example I believe the recent trade wars were more donald trump’s doing, not China’s). I could enumerate other examples where I have remained objective on China, but it gets down to people will either believe me, or they won’t. Same as some people think Menzie is pro-China. But I feel Menzie has always remained amazingly impartial (if not a minuscule minuscule bias towards his native USA). I still hold a lot of affection for different things and people inside China, that’s a separate issue from their F’ed up government.
Welcome to reality Prof DeLong. [ clears throat with s slight hint of arrogance ] I lived it pal.
WOW. Russell Banks passed away. One of America’s greatest writers from roughly the latter 20th century up to now. Really hard to swallow. Well, I’ll finally have a real excuse to get drunk tomorrow:
https://www.theguardian.com/books/2023/jan/08/russell-banks-novelist-dies
HUGE loss for American literature. I feel certain he had more books inside him.
Dear Russell, thanks for knowing being a white male doesn’t always make you feel “privileged” or “entitled” but rather often times makes you think people are biting at your heals and pretending limp dead with their arms around your shoulders. Our souls will be weaker without your chronicles and spiritual support of working class America.
I think it is worthwhile to re-post the below chart, which I originally posted here several weeks ago.
The chart is of the non-seasonally adjusted Q2 data from the QCEW and Establishment reports since available in 2001. In other words, this is the raw data that both Prof. Chinn and the Philadelphia Fed have seasonally adjusted using different methods. The first line is the year, the 2nd is the non-seasonally adjusted number of jobs added in Q2 in the QCEW, in millions, and the 3rd is the non-seasonally adjusted Establishment survey number:
https://data.bls.gov/pdq/SurveyOutputServlet
Year QCEW PAYEMS
2001 2.0* 1.62
2002 2.5 1.79
2003 2.4 1.74
2004 2.9 2.76
2005 3.0 2.81
2006 2.9 2.58
2007 2.7 2.43
2008 1.9* 1.55
2009 0.7* 0.14
2010 3.1 2.61
2011 2.7 2.71
2012 2.7 2.46
2013 2.8 2.61
2014 3.2 2.83
2015 3.2 2.75
2016 2.7 2.62
2017 2.9 2.58
2018 2.9 2.70
2019 2.6 2.44
2020 -12.0* -16.3
2021 3.6 3.25**
2022 2.1 2.91
*=lower than Q2 2022 QCEW
**=higher than Q2 2022 CES (Establishment survey)
The median NSA increase in employment in Q2 in the QCEW has been 2.8 million. The median NSA increase in the Establishment series has been 2.6 million. In the past 22 years, only four- the recession years of 2001, 2008, 2009, and 2020 – have seen lower NSA numbers in the QCEW than 2022.
In those 4 years that the NSA QCEW numbers for Q2 were below the 2022 numbers, the Establishment survey showed actual job losses once seasonally adjusted. The three years with the next higher numbers compared with the QCEW data in Q2 2022 – 2007, 2012, and 2019 – generated seasonally adjusted CES job gains of 90,000/month, 85,000, and 165,000; all of which were far below the 406,000 monthly seasonally adjusted Establishment Survey number in Q2 2022, the second highest estimate in the entire 22 year period.
It’s worth noting that most of the divergence is due to the month of June, where the NSA Establishment survey showed 879,000 jobs gained, while the QCEW showed an actual decline. June is also the month that payroll tax withholding (also an actual aggregate, not a survey) went negative YoY.
The QCEW itself is also preliminary and may be revised. Presumably when the Establishment survey data for 2022 is revised in next month’s report 3 1/2 weeks from now, this issue will be largely resolved.
Russia has responded to Ukraine’s offer of peace talks
https://www.rt.com/russia/569563-russia-ukraine-korea-scenario/
Ukraine wanted war-crime trials. Russia wants Ukrainian land.
Russia’s proposal is more likely to be the basis of any peace deal – you keep the land your troops are sitting on when the truce begins. That’s why Ukraine will continue efforts to recapture territory.
Looks like it will be awhile before fighting stops, but at least both sides are angling for some kind of deal.
“Chinese only respect strength, power, and ability to induce fear…”
Canadians only respect strength, power, and ability to induce fear…
Israelis only respect strength, power, and ability to induce fear…
Indonesians only respect strength, power, and ability to induce fear…
South Africans only respect strength, power, and ability to induce fear…
Catholics only respect strength, power, and ability to induce fear…
“Chinese only respect strength, power, and ability to induce fear…”
agree. that was a poor comment. we should not make such broad strokes about cultures. instead I offer:
The chinese communist party (CCP) only respects strength, power, and ability to induce fear.
after all, I agree with ltr that it is not the chinese people that are committing genocide against the uighyers. it is the ccp.
@ baffling
I apologize, to Professor Chinn and his readership, for not making my true meaning more clear, my comments were directed mainly at the mainland Chinese government, and in the process, hurting anyone’s feelings. ZERO sarcasm. Thank you for pointing out my temporary stupidity. I’ve made this error more than once so, I guess I had it coming.
I’ve know a good many Canadians, Israelis and Catholics. The only Indonesians I’ve spent any time with were Surinamese. I’ve known very few South Africans.
I’m sure most of the Canadians, Israelis, Indonesians and Catholics had considerable regard for intelligence, family, friends, cultural norms, honesty…
Why would you slander them?
This is the little infantile baby’s attempt to portray me as “racist”. I was just waiting for the septuagenerian baby Barkley to join in for the “pile on” What a let down. Barkley must be fatigooooooooed [ alternate spelling fatigued ] today . When I said “Chinese” I assumed regular readers and Menzie would understand I mean the mainland Chinese government (Although if one wants to reflect further it actually does accurately describe a significant portion of the mainland Chinese populace. But that’s a generality, NOT a blanket statement.