Quarterly Census of Employment and Wages data were released today. Recalling that some observers were claiming a recession occurred in 2022H1 (and/or 2022Q2) because household survey and QCEW employment numbers had flattened. With revised Q1 and Q2 data and new Q3 data, we have the following pictures of levels for nonfarm payroll employment and private nonfarm payroll employment.
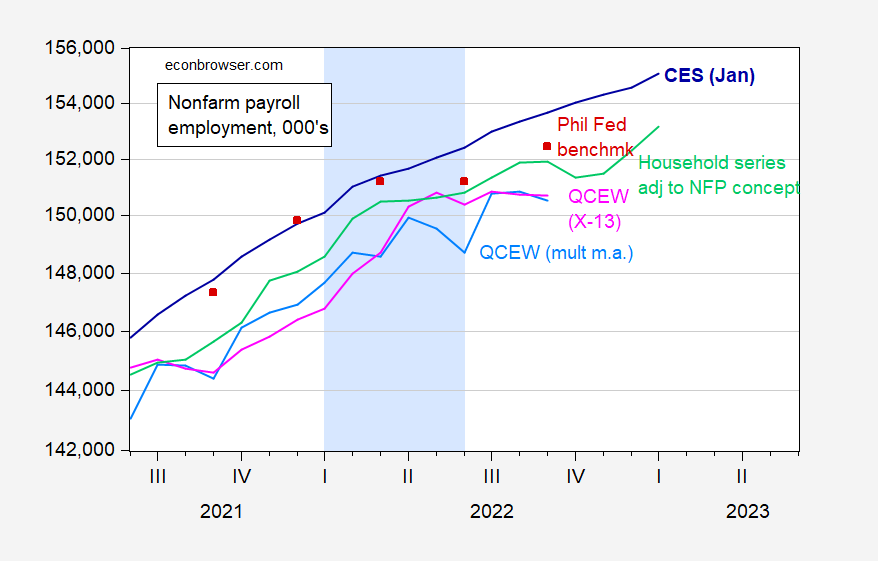
Figure 1: Nonfarm payroll employment from January 2023 CES release incorporating benchmark revisions (blue), household series adjusted to NFP concept (light green), QCEW total covered workers, seasonally adjusted using log transformed Census X-13 (pink), using multiplicative moving average (sky blue), Philadelphia Fed preliminary benchmark (red squares), all in 000’s, s.a. Light blue shading denotes a hypothesized 2022H1 recession. Source: BLS (various) and ADP via FRED, BLS QCEW, Philadelphia Fed via FRED, and author’s calculations.
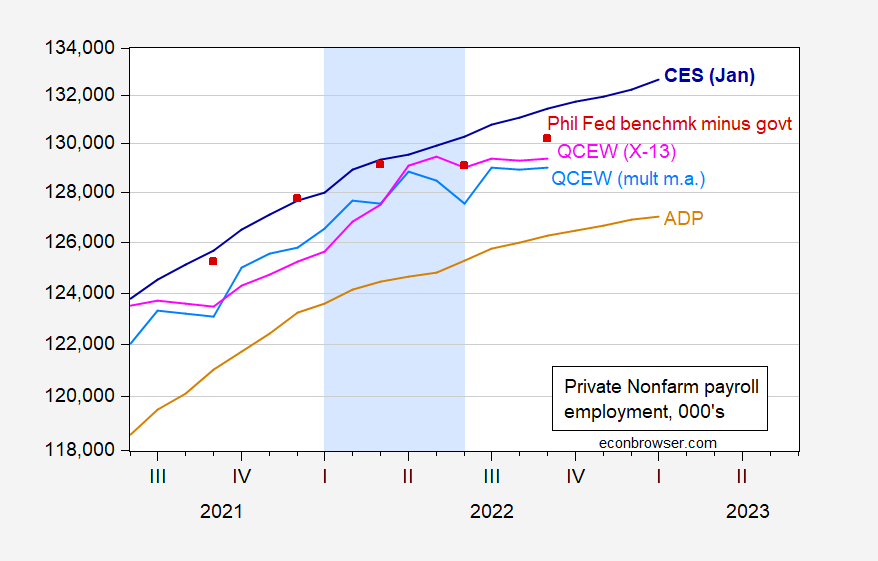
Figure 2: Private nonfarm payroll employment from January 2023 CES release incorporating benchmark revisions (blue), ADP (tan), QCEW private covered workers, seasonally adjusted using log transformed Census X-13 (pink), using multiplicative moving average (sky blue), Philadelphia Fed preliminary benchmark minus reported government employment (red squares), all in 000’s, s.a. Light blue shading denotes a hypothesized 2022H1 recession. Source: BLS (various) and ADP via FRED, BLS QCEW, Philadelphia Fed via FRED, and author’s calculations.
Now, since coverage differs, it’s hard to see if the number of jobs actually increase or not throughout the 2022H1 period. Hence, I show cumulative changes from December 2021 (in 000’s).
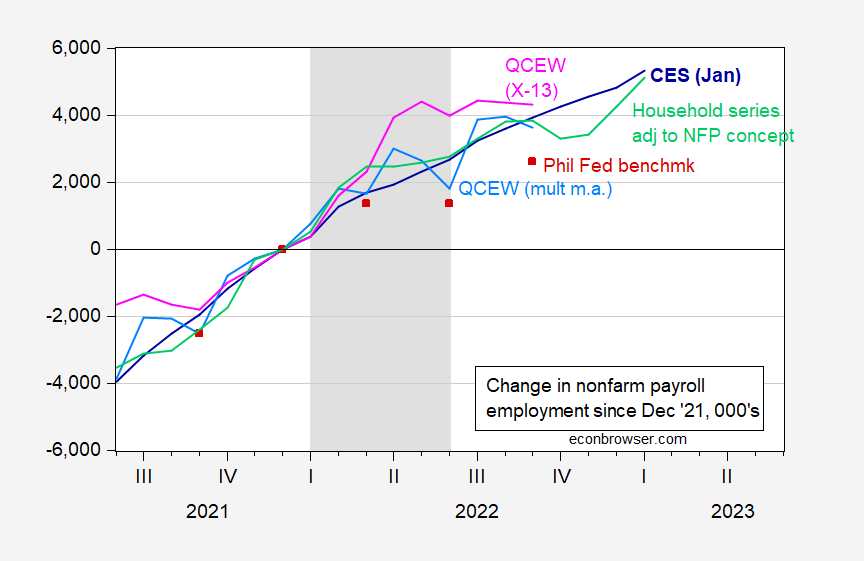
Figure 3: Change from December 2021 in nonfarm payroll employment from January 2023 CES release incorporating benchmark revisions (blue), household series adjusted to NFP concept (light green), QCEW total covered workers, seasonally adjusted using log transformed Census X-13 (pink), using multiplicative moving average (sky blue), Philadelphia Fed preliminary benchmark (red squares), all in 000’s, s.a. Light gray shading denotes a hypothesized 2022H1 recession. Source: BLS (various) and ADP via FRED, BLS QCEW, Philadelphia Fed via FRED, and author’s calculations.
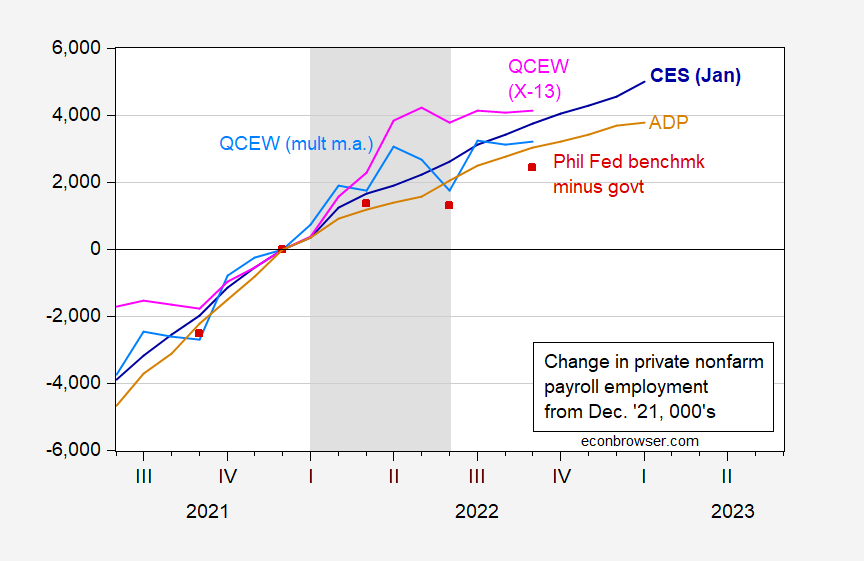
Figure 4: Change from December 2021 in private nonfarm payroll employment from January 2023 CES release incorporating benchmark revisions (blue), ADP (tan), QCEW private covered workers, seasonally adjusted using log transformed Census X-13 (pink), using multiplicative moving average (sky blue), Philadelphia Fed preliminary benchmark minus reported government employment (red squares), all in 000’s, s.a. Light gray shading denotes a hypothesized 2022H1 recession. Source: BLS (various) and ADP via FRED, BLS QCEW, Philadelphia Fed via FRED, and author’s calculations.
The astute observer will see that every series in Figure 3 is higher at end of 2022H1 than it was at the end of 2021H2. Every series, save the Philadelphia Fed’s early benchmark, is higher at 2022M06 than at 2022M03.
In Figure 4 (private nonfarm payroll employment), once again every series is higher at the end of 2022H1 than it was at the end of 2021H2. Two series — the Philadelphia Fed early benchmark minus measured government employment and QCEW seasonally adjusted using moving average — show a slight decline going from March to June. But all other series (including the ADP series which relies upon actual payroll processing data, and hence independent of CES or CPS) were rising.
To the question of trends going forward, every single series is higher at 2022M09 than 2022M03.
So, in assessing this comment from January :
The first pertains to the credibility of sources. Which should we believe? The CES or the HH survey? Menzie argued for the CES. This seemed somewhat problematic in H1, as we saw decreasing productivity and falling GDP. If we were adding so many full time jobs, why was both productivity collapsing and GDP declining?
The HH (CPS) survey, by contrast, was showing that 1) employment was flat after March, and 2) that more than 100% of the job gains were coming from part time work or multiple jobs, suggesting a surge in lower wage work resulting in a negative effect on productivity. That seemed more plausible to me.
At the same time, I thought it possible that both surveys were in fact correct, but garbled with the effect of the recovery from the suppression, thereby creating misleading impressions because we were misinterpreting the data. That still seems possible, though I’ve read that others think the CES was manipulated to provide a more rosy picture heading into the election. In any event, if one thought that both surveys might be in some sense correct, perhaps the discrepancy could be reconciled by multiple job holders. As it turns out, though, multiple jobs only account for 314,000 of 2.7 million jobs per the CES in the March-Nov. period, the period I believe we were debating. So that supposition proved incorrect, as Menzie pointed out and I acknowledged.
Then we learned that the CES was fundamentally incorrect, with the Fed reducing the increases in jobs from 1.1 million to 10,500 from March to June. For that period, it rendered the whole reconciliation issue moot, for it asserted that the CES had been producing phantom jobs. No reconciliation was needed.
As such, the HH survey appears to be the more credible source, certainly through June and probably through most of the rest of the year. And that suggests that the growth in employment has come entirely from part time and multiple job holders.
We can say almost all of what is stated is wrong. On part time jobs. On CPS vs. CES. On CES manipulation, there is no evidence (unless you found it on the Italian satellites changing vote counts). On lower wages causing measurably lower productivity, that’s so wrong that I can’t even say anything. On the comment: “Then we learned that the CES was fundamentally incorrect, with the Fed reducing the increases in jobs from 1.1 million to 10,500 from March to June.” , I will observe that it was researchers at the Philadelphia Fed that reduced the estimated job increase count, not the Fed as an institution.
I haven’t completed my look at the latest QCEW report, for Q3, but I have a few comments so far.
1. The only really direct way to compare the QCEW data with the CES is YoY for private payrolls.
2. The YoY comparisons improved slightly throughout Q3, from 4.0% (June), to 4.1%, 4.2%, and 4.3% (Sept.).
3. That being said, the QCEW YoY comparisons are lower than the CES YoY comparisons every single month beginning from September 2021 through September 2022, and are more than -0.3% lower every single month from January through September 2022, except for February.
4. In Q2, the QCEW in June 2022 was particularly bad in comparison with the previous 20 years (explaining most of the Philadelphia Fed’s calculation), while July was extremely good in that same comparison. August was average, September was poor again.
5. I note in passing that YoY withholding taxes paid went negative in June 2022, but recovered in July as well.
6. As of September, but not before, the QCEW YoY comparisons are closer to the CES number than they are to the Household Survey number.
7. Here is my big question: why are the QCEW YoY comparisons so consistently below the CES data for *an entire year?* The only possibility I can come up with is that, separately, the Census Bureau’s “Business Formation” statistics have been off the proverbial charts since the pandemic began. Are all of those jobs missing in the QCEW new sole proprietor businesses? Or are the next round of CES revisions going to be substantially lower? I wonder if others have any better explanations.
Personal services is indeed a lot of individuals. It’s a large reason nfp surged in January as payrolls are normalizing like covid never happened. It’s why going by traditional methods of business cycle accounting aren’t working.
I don’t have a better explanation, but I will make a couple of observations.
Our various systems of seasonal adjustment may not be serving us as well now as in the period prior to Covid. The Covid shock and various government responses to the shock were abrupt and large. Their impact on unadjusted data was larger than normal seasonal swings in many cases, and that means data from that period are likely to overwhelm the seasonal adjustment systems until they wash out with time.
Structural change has been sudden and large – as evidenced by the new high rate of business formation – and our programs for gathering and publishing data may reflect the results of big structural changes in confusing ways.
There are surely other effects I have missed, but just these two increase our uncertainty about the data we see and our interpretation of the data. The lesson I draw from this is that we should be humble in our claims about the performance of the economy. Just because a relationship has yielded accurate forecasts in the past is not a good reason to insist on the rightness of a forecast now.
I am not familiar with any literature on the reliability of data after large shocks or whether there is any literature on cleaning up messy understanding of the data when a mess exists. If such a literature exists, I’d appreciate being directed to it.
I’ve now completed my review of the QCEW update. The bottom line is that, an incredible amount depends on how one seasonally adjusts. I come out about where Prof. Chinn has the Philadelphia Fed dot plot: a very weak Q2, followed by a strong Q3.
But “how” weak and strong they are depends, as I said above, on how one seasonally adjusts. Essentially June was extremely weak, only better than 2009 since the turn of the Millennium, while July was extremely strong only weaker than 2020 and 2021. The two months together are also stronger than any year since 2001 except for 2020 and 2021.
If I take CES seasonally adjusted data through March 2021 as gospel, and apply the QCEW YoY% growth rates starting with that, I get a Q2 that only adds 45,000 jobs in total, but then a roaring Q3 that adds 884k jobs in July, 750k in August, and 733k in September.
On the other hand, if I take the QCEW numbers for each month of Q3, compare with the closest matching QCEW numbers in the 20 previous years, and then average how the CES seasonally adjusted those numbers, I get +1.2-1.3M in July, but only about +175k in August and +150k in September.
The first method gives me a seasonally adjusted CES # of +2,367,000 jobs added in Q3, while the second gives me only +1.7M jobs added.
I continue to be concerned about why the QCEW, which is the gold standard, is so consistently below the YoY% growth comparisons in the CES survey for an entire year (so far). The Census Bureau really ought to address this discrepancy.
We must all remember that economics is not a fit subject for discussion on an economics blog now that the mid-term elections are over. The troll choir has chastised out host and several commenters for revisiting the issues of H1 recession and Q2 jobs as revisions to data from those periods are released. The very trolls who insisted that there was a recession and that jobs were lost now insist that setting the record straight about the economy is a waste of time. On an economics blog.
How about that Red Wave, boys?
Off topic, that debt ceiling thingie –
The Bipartisan Policy Center is out with an updated “X date” estimate for default by the Federal government. The central estimate is late summer or early fall, but with a proviso attached:
“Indeed, if tax season revenues fall far short of expectations, there could even be a “too close for comfort” situation prior to quarterly tax receipts due on June 15.
“The government is projected to spend more than $3 trillion and take in approximately $2.5 trillion between February and June, and variation of a few hundred billion dollars in either direction would not be shocking yet would markedly affect the X Date. As a result, the projection window is wider than usual.”
https://bipartisanpolicy.org/press-release/feb-23-debt-limit-x-date/
I was recently advised in comments not to worry about such things, but these guys say there is a worry and they show their work. The magnitudes involved are large, making large misses in estimates pretty likely.
Until we see how revenues and expenditures shape up, there is a growing risk of default up to June 15. If we make it past June 15, then we have till late summer.
Unless, of course, we just go ahead and pass the debt ceiling increase.
I have been squawking a bit about seasonal adjustment and messy data due to Covid lately. Thought I’d maybe toss out one example of what I think could mess up assessment of the health of the economy. I’ve chosen a weather example, because it’s easy to demonstrate.This is meant simply as an example, not as the be-all and end-all of data distortions.
In January of this year, the U.S. as a whole experienced the fewest heating degree days of any January since 2006. The American Gas Association reports 19.1% fewer heating degree days than in January of 2022 and 18.1% fewer than the average over what I’m guessing is 30 years of Januaries (Januarys?)
https://www.aga.org/research-policy/resource-library/weekly-and-monthly-heating-degree-day-data/
What effect might that have on reported economic performance? For one thing, full-time workers who missed work due to weather was tied for the lowest in a decade. January of 2023 was the first time in 13 years that fewer people missed work in January due to weather than in the prior December. You remember that big upside employment surprise in January? Conventional estimates put the lift to January employment from weather at around 125,000 jobs.
https://data.bls.gov/timeseries/LNU02033224&years_option=all_years
Retail sales in January were up 3.0% from December. Even taking out autos and gasoline, sales were up 2.6%, the best monthly gain since March of 2021. Some of that was probably shoppers waiting for price cuts after Christmas – retail sales in November and December were weak – but good weather and good sales go together. Does it really make sense to build in an extra 50+ basis points of Fed rate hikes because January was warm?
https://fred.stlouisfed.org/graph/?g=10n26
This weather stuff cuts both ways. Industrial production was flat in January. Big deal, right? Flat. Except that manufacturing production rose by 0.9%, the best gain in 11 months. Utility output fell sharply, masking what was otherwise a healthy report. Weather messed up the headline industrial production number.
https://fred.stlouisfed.org/graph/?g=10n3x
Menzie has shown here that the (often politically motivated) debate over recession and employment earlier this year was based to a considerable extent on preliminary data that would eventually show neither recession nor labor market weakness. New Deal Democrat notes continued dirgences between employment series which normally don’t diverge all that much. This just seems like a particularly bad time to point at your own personal very favorite indicator and claim “I was right all along!”
January alone is a minor freak show for simple weather effects on the data. No accounting for data quality, what may be badly distorted seasonals, supply chain whiplash, changes in fiscal policy, whether housing data or term spreads have the same predictive ability as in the past and so on. End of tantrum.
That “growing risk of default” would, of course, be unconstitutional.
That, in turn, would give a certain post-logic congressional representative (Good Morning, Ms Taylor Greene!) justification to call for Joe Biden’s impeachment.
Impeach her for treason. Your point is dead.
off topic, but this morning’s GDP report was revised down 0.2% because the deflator was revised up 0.4%, from 3.5% to 3.9%; current dollar GDP growth was actually revised 0.2% higher, from 6.5% to 6.7%…
most of that was due to the revised seasonal adjustments to 2022’s CPI, which is used in creating the PCE price index….real 4th quarter PCE growth was revised from 2.1% to 1.4%
The Indian government wants to coddle Putin’s war crimes:
https://www.reuters.com/world/india/india-says-era-is-not-war-g20-finance-meet-starts-2023-02-22/
India does not want G20 nations to discuss additional sanctions on Russia for its invasion of Ukraine, government sources said on Wednesday, as it hosts a meeting of the bloc’s finance chiefs at which the United States and allies were set to push for tougher action. India also was pressing to avoid using “war” in communique language to describe the conflict, which enters its second year on Friday as the meeting starts, G20 officials said. India has kept a neutral stance on the war, declining to blame Russia for the invasion, seeking a diplomatic solution and sharply boosting its purchases of Russian oil.
Selling one’s soul just to buy cheap oil.
i don’t know if it counts as soul-selling, but South Africa’s navy will be helping China defend the Indian Ocean shipping lanes for Russian oil…
https://www.cbsnews.com/news/russia-china-south-africa-military-exercise-during-ukraine-war-no-hypersonic-missile-test/
More US military presence in Taiwan
https://www.wsj.com/articles/u-s-to-expand-troop-presence-in-taiwan-for-training-against-china-threat-62198a83?st=ik6ho99mtdotnz5&reflink=desktopwebshare_permalink
The U.S. is markedly increasing the number of troops deployed to Taiwan, more than quadrupling the current number to bolster a training program for the island’s military amid a rising threat from China.
The U.S. plans to deploy between 100 and 200 troops to the island in the coming months, up from roughly 30 there a year ago, according to U.S. officials. The larger force will expand a training program the Pentagon has taken pains not to publicize as the U.S. works to provide Taipei with the capabilities it needs to defend itself without provoking Beijing.
The number of American troops, which has included special-operations forces and U.S. Marines, has fluctuated by a handful during the past few years, according to Defense Department data. The planned increase would be the largest deployment of forces in decades by the U.S. on Taiwan, as the two draw closer to counter China’s growing military power.
Beyond training on Taiwan, the Michigan National Guard is also training a contingent of the Taiwanese military, including during annual exercises with multiple countries at Camp Grayling in northern Michigan, according to people familiar with the training.
Who would be obnoxious enough to sponsor a bill that would make the AR-15 the National Gun of America?
https://nymag.com/intelligencer/2023/02/george-santos-wants-to-name-ar-15-americas-national-gun.html
George Santos of course.
Herschel Walker’s campaign receives notice flagging ‘apparent violations’ including ‘recount’ fund
https://www.msn.com/en-us/news/politics/herschel-walker-s-campaign-receives-notice-flagging-apparent-violations-including-recount-fund/ar-AA17Q6Mh?ocid=msedgdhp&pc=U531&cvid=77dfa1cc3fe34bc38d8bf1a8d7a3cef7&ei=10
Yea – Walker is a MAGA drifter. But I bet Moses will enjoy this link for another reason … Nikki Haley smiling at stud farm Hershel as if she wants to be his next conquest.