In the past few years, a persistently low level of consumer sentiment, as measured by the University of Michigan, Conference Board, or Gallup surveys, relative to conventional economic measures has puzzled analysts, including this one [1] [2] [3] [4] [5]. This puzzle is illustrated by the evolution of the U. Michigan series (FRED series UMCSENT), and the fitted values using 2011M01-2024M08 data on unemployment and year-on-year inflation.
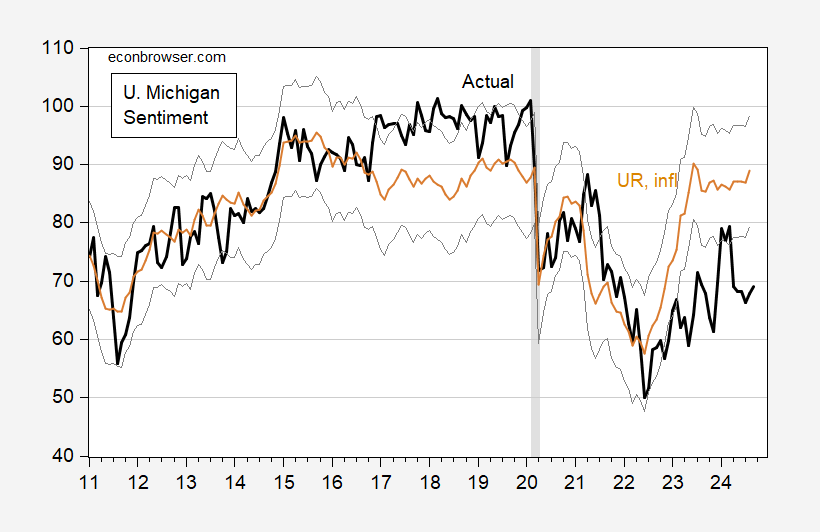
Figure 1: University of Michigan Consumer Sentiment index (bold black), fitted values using unemployment and inflation (see text) (tan), +/- 1 standard error band (gray line). NBER defined peak-to-trough recession dates shaded gray. Source: University of Michigan via FRED, NBER, and author’s calculations.
Here’s the regression results (where inflation is 12 month growth rate, in %):
UMCSENT = 104.12 –2.455 UNRATE – 3.727 INFL
Adj-R2 = 0.51, SER 9.256, DW = 0.23, N=164, Sample 2011M01-2024M08. Bold denotes significance at 10% level using HAC Newey-West standard errors.
Peak gap is in mid-2023 and end-2023.
Partial resolution is shown in the following picture, motivated by Bolhuis et al (2024).
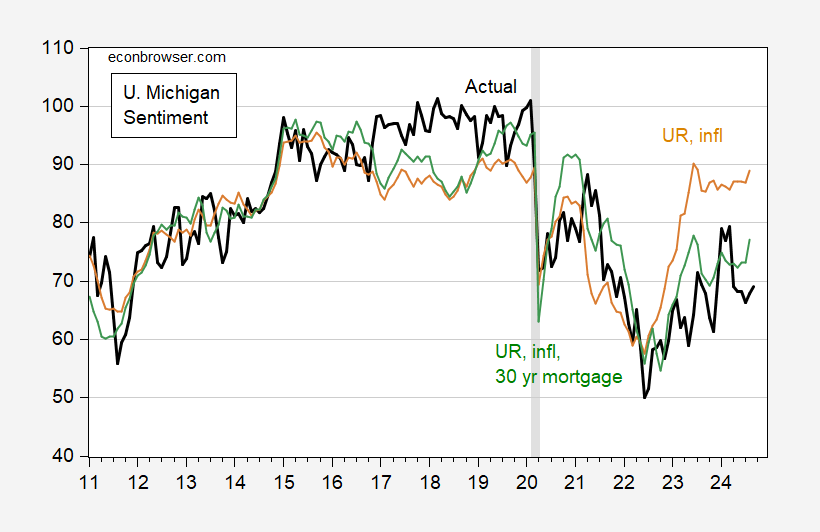
Figure 2: University of Michigan Consumer Sentiment index (bold black), fitted values using unemployment and inflation (tan), using unemployment, inflation, and 30 year mortgage rate (green). NBER defined peak-to-trough recession dates shaded gray. Source: University of Michigan via FRED, NBER, and author’s calculations.
The green line is the fit using the baseline equation augmented with 30 year mortgage rates.
UMCSENT = 135.67 –3.669 UNRATE – 3.328 INFL – 5.97 MORTGAGE30US
Adj-R2 = 0.73, SER 6.785, DW = 0.48, N=164, Sample 2011M01-2024M08. Bold denotes significance at 10% level using HAC Newey-West standard errors.
Where MORTGAGE30US is the FRED series for the 30 year mortgage rate in the US. Note that in both regressions, I’ve used HICP (which does not include housing costs) as my price index. The mortgage rate is almost as important as the unemployment rate, according to standardized (beta) coefficients (0.53 vs. 0.58, and 0.62 for inflation).
These results indicate that a 1.1 percentage point decline in MORTGAGE30US since the October 2023 peak (thru August) has accounted for an approximately 6.5 point increase in UMCSENT.
Similar results are exhibited by the Conference Board’s Consumer Confidence index (although HICP y/y inflation doesn’t show up as statistically significant):
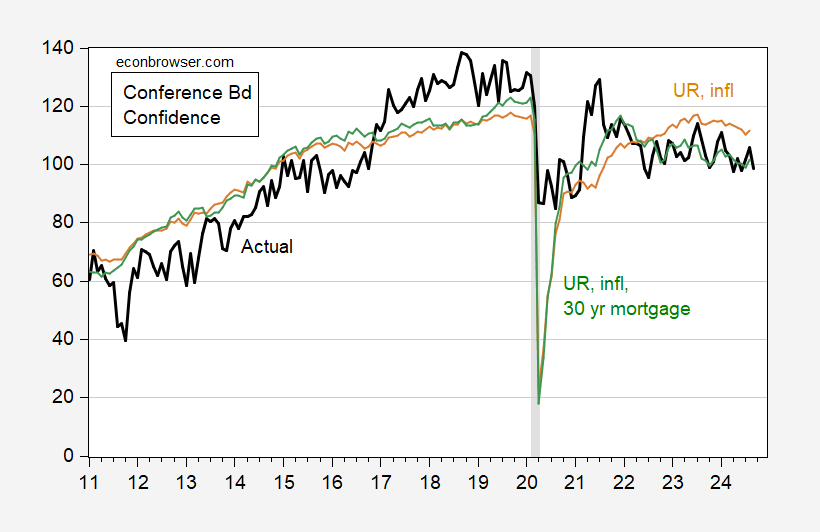
Figure 3: Conference Board Consumer Confidence Index index (bold black), fitted values using unemployment and inflation (tan), using unemployment, inflation, and 30 year mortgage rate (green). NBER defined peak-to-trough recession dates shaded gray. Source: Conference Board via Investing.com, NBER, and author’s calculations.
The regression results are:
CONFIDENCE_CONFBD = 175.28 –9.544 UNRATE – 0.716 INFL – 4.984 MORTGAGE30US
Adj-R2 = 0.63, SER 13.640, DW = 0.40, N=164, Sample 2011M01-2024M08. Bold denotes significance at 10% level using HAC Newey-West standard errors.
Why is this only a possible resolution? If one extends the sample before 2011M01, the regression results fall apart. Inclusion of MORTGAGE30US then yields a positive coefficient, insignificant at first, and significant as the sample extends further back in time (see e.g. 1991M01-2024M08; one can use CPI ex-shelter as a longer series for prices). Since this instability in the relationship is not associated with the change in including housing costs in the CPI as noted by Bolhuis et al (2024), I think of this as a remaining puzzle. Perhaps if housing prices were also included, this would remedy the problem (actually, I have checked – it kind of does).
Finally, note that mortgage rates enter asymmetrically into UMCSENT for Democrats vs. Republicans. Mortgage rates have an insignificant impact for Democrats’ sentiment. A Trump dummy dominates for both Republicans and Democrats, in terms of influence as measured by a standardized coefficient. Hence, the inclusion of mortgage rates do not explain all the seemingly anomalous behavior of sentiment indices.
Hey – check out how Mike Lindell has brought down the price of his worthless pillows and showed his support for the Nazis!
MyPillow Guy Doubles Down On Pillow Price Evoking Nazi Symbolism
https://www.msn.com/en-us/news/politics/mypillow-guy-doubles-down-on-pillow-price-evoking-nazi-symbolism/ar-AA1rcHlZ?ocid=msedgdhp&pc=U531&cvid=031ca45d2c114db59f961b03729806f5&ei=17
Conspiracy theorist and pillow-pusher Mike Lindell is doubling down on a controversial pillow price after selling some of his products for $14.88, a figure seen as symbolic for white supremacists and neo-Nazis. Lindell, the CEO of MyPillow, had advertised the discounted price in various social media posts Friday. “Sleep like a dream with our Standard MyPillow for just $14.88!” the posts said. Lindell received thousands of comments on X, formerly Twitter, criticizing the price due to its similarity to “1488,” a code used by hate groups. Among white supremacists, “14” is shorthand for a racist 14-word slogan, while “88” refers to an abbreviation of “Heil Hitler,” since H is the eighth letter of the alphabet.
The man knows his customers. Nothing as restful as putting your head down on a nazi pillow – if you are a nazi.
This comment is on the use of our EXIM subsidy to promote Australian and US operations in a particular market:
US pledges $786m to Australian rare earths and lithium projects
https://www.msn.com/en-us/money/companies/us-pledges-786m-to-australian-rare-earths-and-lithium-projects/ar-AA1rcKCn?ocid=msedgdhp&pc=U531&cvid=2b37b72b514147e7a13ed54da0b0eaf5&ei=12
he Export-Import Bank of the United States (EXIM) has offered $786m (A$1.14bn) in debt funding to support two Australian companies to develop critical minerals supply chains. Australian mineral resources company American Rare Earths announced on Tuesday (24 September) that it received a letter of interest from EXIM for a $456m debt funding package to support the construction and operation of the Cowboy State Mine (CSM) area at Halleck Creek in Wyoming. Melissa Sanderson, one of American Rare Earths’ board of directors, explained that the company is hopeful the debt funding package will help attract additional private funding for the CSM project. The funding package was offered under EXIM’s Make More In America Initiative and has a proposed repayment tenor of 15 years.
On the same day, Australian critical minerals company Anson announced that EXIM offered $330m to the company to finance the construction of a lithium production plant in the Paradox Basin in Utah. Bruce Richardson, Anson Rescources’ executive chairman and CEO, said: “We are delighted to receive this letter of interest from US EXIM following extensive collaboration with multiple government and industry stakeholders in the United States. “The United States seeks to develop a domestic and reliable source of critical minerals and the Paradox Basin, which we believe is the largest source of lithium in the United States, has a significant role to play.” In August, EXIM offered a similar debt funding package of $600m to Australian Strategic Materials to support the Dubbo rare earths project in New South Wales. Last year, the US and Australia established a critical minerals taskforce designed to attract investment in minerals processing and reduce China’s dominance in the market. China currently controls more than 80% of global supply.
Amazing what you can do when you have a targeted strategic industrial policy, rather than incompetent rage statements and jokes about “infrastructure week”. Competence matters, a lot!
I’d be curious to see the importance of mortgage rates for confidence between Democrats and Republicans tested by locale. Urban areas tend to vote Democratic, and have higher rates of renting vs ownership.
It seems possible that if we correct for locale, or perhaps for home ownership, the D/R split over mortgages might be reduced.
I just checked with FRED on the CPI series for rent on primary residence. Its up 22% since January 2021 which does not strike me as some incredibly high increase over this time period. I would push back, however, by noting “some people” have been saying “the rich is too damn high” for years. Of course those people may be residents of Manhattan.