In today’s NY Times, Peter Eavis writes about the message in “soaring bond prices”:
…a huge bond market with a strong track record for predicting economic problems is flashing a warning sign right now. … The prices of Treasury bonds are rallying fiercely.
Source: Peter Eavis, “Soaring Bond Prices May Sound an Economic Warning,” NY Times, 7 January 2015.
Over the longer term, the nominal yield should match the nominal GDP growth rate; however, in terms of indicators of recessions, the term premium is more typically examined. And here, there is some indication of a slowing. Figure 1 shows spreads for 10 year-3 month Treasurys and 10 year-2 year Treasurys.
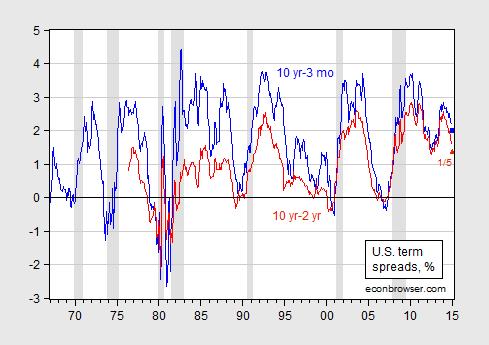
Figure 1: Ten year minus three month Treasury yields (blue), and ten year minus two year Treasury yields (red). Observation for January is for 1/5/2015. NBER defined recession dates shaded gray. Source: Federal Reserve Board via FRED, NBER, and author’s calculations.
Both the 10yr/3mo and 10yr/2yr spreads remain positive.
Of course, one problem is that we’ve hit the zero lower bound, so that it might be the case that the relationships that obtained before don’t anymore; in particular, the flattening of the yield curve might not signal incipient Fed tightening (as much as in the past).
One could appeal to real yield spreads (see Figure 2), but we don’t have enough of a track record to be able to infer much about future growth.
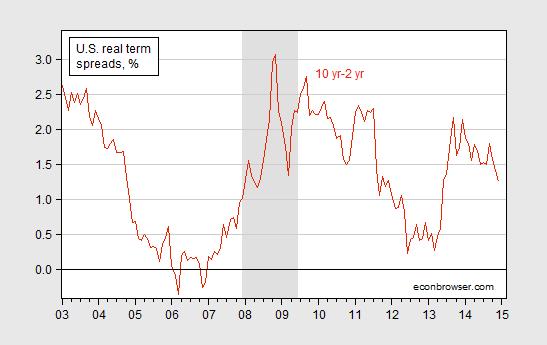
Figure 2: Ten year TIPS minus two year Treasury yields minus Cleveland Fed expected inflation measure (dark red). NBER defined recession dates shaded gray. Source: Federal Reserve Board via FRED, Cleveland Fed, NBER, and author’s calculations.
The absence of such a track record with the real yield curve suggests appealing to the standard (nominal) yield curve. Chinn and Kucko (2014) provide a series of probit estimates of the link between the spread and recession (using NBER indicators). Using the estimates for the 1998-2013 period (Table 9), the values as of 1/5/2015 indicate an 11% probability of recession in the next 12 months. However, the adjusted R2 is only 0.19.
Based on the 1/5 values, the point estimate for growth in industrial production over the next 12 months is around 2% (Table 3).
Note that aside from the ZLB constraint, another problem with interpreting the outlook based upon historical correlations is other things that might have expected the behavior of the yield curve. If the expectations hypothesis of the term structure is not the only determinant of long term rates, and some version of the preferred habitat model obtains, then it could be that long term rates are depressed due to excess savings from abroad. That is a theme that we’ve been discussing for a long time, [1] [2] but now it’s exacerbated by the flight to safety.
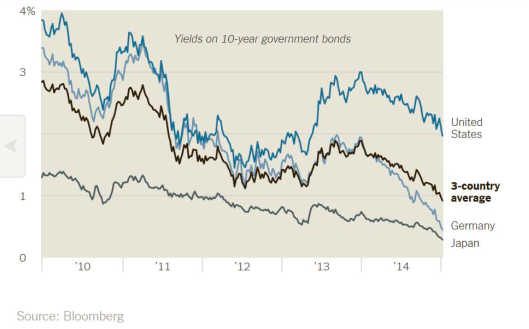
Ten year-three month term premia in Japan and Germany remain (just barely) positive.
Update, 5pm Pacific: Using the Xia-Wu shadow Fed funds rate instead of the standard Fed funds rate results in a much steeper yield curve, as shown in Figure 3.
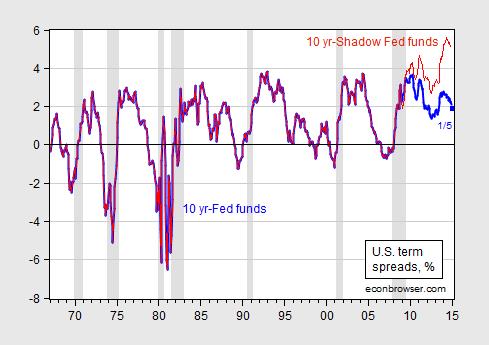
Figure 3: Ten year yield minus effective Fed funds rate (blue), and ten year minus Xia-Wu shadow Fed funds rate (red). Observation for January is for 1/5/2015. NBER defined recession dates shaded gray. Source: Federal Reserve Board via FRED, NBER, Xia-Wu, and author’s calculations.
Nah, it is oil cash moving into bonds figuring out what to do next. I would not be surprised to see a mild selloff once the oil decline bottoms and the yield curve steepen……….probably about the time FOMC rate hikes begin.
In similar vein, some of what looks like flight to safety could be a reach for yield. Bunds also represent safety, but at a much lower yield than Treasuries. Accounts late to the party may also be trying to avoid FX losses on euros.
We are experiencing “secular stagnation” of a Long Wave debt-deflationary regime and Schumpeterian depression, as has been underway since 1998 in Japan and as occurred in the US during the 1830s-40s, 1890s, and 1930s-40s.
In Japan, the yield curve has not inverted since 1992. In the US, the yield curve did not invert from 1931 to 1954, and using similar proxies, 1839-47 (later in the UK) and 1893-1901.
Owing to demographic drag effects and excessive debt to wages and GDP, the debt-deflationary regime is likely to persist into the early 2020s, with the US and EZ (and eventually China) losing a cumulative amount of real GDP growth from 2000 of 30-35% that otherwise would have occurred had the trend rate of growth continued since 2000. That is to say, the loss of growth that occurred in 1837-47, 1893-1901, 1929-33 and 1937-42, and in Japan since 1990 will occur over 20-25 years this time instead of 4-7 to 12-13 years, i.e., a “slow-motion depression”.
BC: Quite on point regarding depression. The Great Depression is generally understood to have lasted a decade from the 1929 peak. Average annual growth during the Great Depression was 0.7%. Since that time, decadal growth has rarely fallen below 3%. The exception being when the end point of the 10-year period was the deep trough of the 1982 recession. For 2 years surrounding that trough, decadal growth dipped below 3% before rebounding. But never below 2%.
All that changed with the Great Recession. Decadal growth has been below 2% ever since 2009Q1. This is far from normal. This recovery’s average growth of 2.3% since the 2009Q2 trough is an estimate of what the rest of the decade since the 2007 cycle peak might look like. (2.3% is probably generous.) Actual growth to date plus rest of decade at 2.3% computes to 1.5%. Compare this with the 0.7% of the 30s. I’d become quite aware of this a few years back. After much reflection I coined the term “Stealth Depression.” This is your “slow-motion depression.”
The substance of your comments could not be more correct. I’d only add that the main impediment is the historic level of debt policy makers and economists put us on the path to some decades back. Debt is the main impediment to growth. There are other impediments as well. Moreover, there is an another category I call “growth drains.” Example being what’s happening to labor force participation. Together growth drains and impediments will keep decadal growth in a depressed mode well beyond the span of a single decade that demarked the Great Depression. A starting place to see this is in recognizing that growth in recent years has been artificial due to historic low, artificial interest rates (ZIRP and QE). There will be a payback for this. Malinvestment will extract a payback. Interest rates have yet to normalize. When they do growth will be restrained on that account. Asset bubbles abound. Kindleberger, Minsky, and others are clear – all bubbles eventually burst. Many including myself see another financial crisis coming. The accompanying recession will take growth down and cut another notch out of the averages. In short, we are in a box canyon. Its walls are debt. Debt-to-GDP is far beyond optimal. There is no longer any good way to get it back down. Neither is there understanding (on this blogsite) or political will (in Congress) to do the painful necessary things.
JBH, indeed.
I would add that the US performance is even weaker without the outsized military spending to private GDP since 2001.
WRT to debt, another constraint today associated with excessive debt is the phenomenon of hyper-financialization of the US economy. Specifically, total net annual flows to the financial sector equal, and occasionally exceed, total annual GDP output, meaning that all net value-added output of the US economy is pledged to the financial sector and, by extension, those who own the disproportionately large, controlling share of financial assets, i.e., the rentier top 0.01-0.1% to 1% of households.
Eras of “secular stagnation” of the Long Wave historically have coincided with excessive debt/asset valuations to GDP, extreme wealth and income concentration and inequality, drag effects from the aging of a peak demographic cohort (related to income inequality), and the resulting secular deceleration of the trend rate of real GDP per capita.
The asset bubbles the Fed is desperately attempting to keep inflated for their TBTE bank owners and benefactors create and sustain a net rentier claim against labor, profits, and gov’t receipts in perpetuity.
Moreover, the combined total of gov’t spending, private health care and education spending, and household and business debt service is an equivalent of well over 50% of GDP. The economy cannot grow unless gov’t spends more for war, food stamps, and Obamacare subsidies, households and firms take on more debt, college students borrow more for tuition than they can afford to pay back, and the country experiences growth of illness and costly, lingering death for elders. But if these sectors grow, they place a burden on the share of the private sector that is less than 50% of GDP, constraining overall growth indefinitely. (A similar effect exists in the EZ with gov’t spending of 48-50% of GDP, and more for some countries.)
With labor’s share of GDP at a record low, resulting in decelerating marginal productivity of labor and trend real GDP per capita, firms have even more incentive to increase the scale of labor savings to reduce costs under a “slow-motion depression” regime, especially now in the service sector that employs 80%+ of all workers. The once-in-history disruptions coming to health care, education, retail, distribution, business analytics, etc., will further constrain growth along with the aforementioned factors.
Also, the cost of oil consumption to final sales of ~3-3.5% and the associated net energy cost of energy extraction becoming prohibitive to further growth of extraction adds yet another secular (permanent?) constraint on real growth per capita.
We have arguably sufficient technological advances to last a lifetime or longer. What is required hereafter are economic, social, and political innovations to catch up to our tools and associated processes in order to respond quickly enough so as to adapt successfully as a society to the effects from integration of smart systems, intelligent systems/AI/SAI, biometrics, nano-electronic sensors, bioinformatics, robotics, quantum computing, 3-D printing, etc., which will result in an unprecedented scale of labor savings and thus elimination without replacement of paid employment and purchasing power of tens of millions of Americans in the next generation. Economists, CEOs, politicians, and mass-media influentials have just barely begun to examine and discuss this once-in-history phenomenon occurring coincident with the take off phase of the emerging Schumpeterian techno-economic paradigm.
JBH….isn’t the debt that matters only external debt? Internal debt just involves transfers, not a macro cost.
I’ll presume to answer for myself, not for JBH.
The debt “that matters” is private debt as a share of wages and GDP, the net financial flows from same as a share of wages and GDP, AND the change rate of same.
As such, total net flows to the financial sector (and financialized sectors) consume/absorb/are pledged to all private real value-added after-tax labor product and profits, and gov’t receipts for social goods, forever and ever, Amen.
Pete: Systemic risk, leverage, contagion, derivatives ($300 trillion worth at current count), drying up of the repo market, fire sales of assets falling in value when a bubble bursts –these and more are why owing internal debt to ourselves is not a wash. It is a massive problem. Especially since global debt (proportioned to GDP) is at a historic record level. Go to John Geanapolous’s Yale website and read a few of his papers to get a better handle on leverage. Parenthetically, most of the big banks in Europe are insolvent. They are being nursed along by the ECB in a daisy chain like fashion, with sovereign European debt taken onto the ECB’s balance sheet, that in turn funds European banks, who can then buy more of newly issued sovereign debt flowing to the market because of the ongoing deficits throughout the zone. This can kicking is rapidly coming to a head by what is happening in Greece, the most indebted nation in Europe. Six straight years of falling real GDP have created a buildup of so much pain that in the upcoming general election this month, the first anti-Euro government ever will be voted into existence. The risk – and it is a large one – is that Greece will exit and the eurozone will splinter. Deutsche Bank is sitting on a $100 trillion pile of derivatives. This is cross-bordered by unfathomably complex linkages. There is no clean simple world of internal debt anymore. Even if there was, the old canard about debt you cite is simply wrong. Not your fault of course.
Even more fundamentally, debt is the antithesis of saving. Today’s consumption on excessive credit is stealing from the future. Investing in a productive asset is not stealing. But consumption is. In the process of pushing debt beyond optimal, saving perforce suffers. The seed corn gets eaten and potential growth is ongoingly inhibited until such time that the debt ratio returns to optimal. In the process of returning to optimal, credit decelerates and GDP growth falls below what it otherwise would be based on income growth. A long period of payback ensues.
Your list of risks associated with internal debt (true for all debt) is exactly the point. In fact external debt really isn’t all that much riskier than internal debt, as long as it’s denominated in the currency of the debtor.
Since it is the risk of financial contagion that’s paramount, that risk ought always to be an explicit part of our assessment of debt. Treasuries are treated as a safe asset class, so are hoarded when other forms of debt are shunned. The financial sector runs on repo – short-term lending against Treasury collateral. That arrangement protects the lender, but does nothing to protect the financial system as a whole. The problem in the Lehman episode was not that there was too much government debt. The problem was that there was too much leverage, with Treasury debt suddenly very scarce. The federal deficit was not a causal factor in the debt squeeze, but has been treated as part of the problem by fiscal policy makers and pundits.
Depression? Here, in the USA? Did you even read the post? Nothing like that in the data. In fact, it looks exactly the opposite, as we will see again on Friday…
XO, real GDP has decelerated since 2000 from 3.3% to 1.6% and less than 1% per capita. Trend real GDP per capita since 2007-08 is near 0%. Consequently, the US has lost ~20% of growth of real GDP that otherwise would have occurred had the trend rate of growth continued after 2000. This is the same conditione Japan experienced by the early 2000s as the country entered its second lost decade of “secular stagnation” and “slow-motion depression”.
The decline in the US U rate since 2009-10 is primarily attributable to the decline in labor force participation of 8 million workers. Had the labor force continued growing at the trend rate through 2000-07, the U rate would be 12-13%. Had the labor force grown at the rate of population, the U rate would be 10%.
Employment per capita has yet to get back to the 2007 peak.
Private, full-time employment per capita is at the level of the mid- to late 1980s.
Jobless claims as a share payrolls are at the lows of the cyclical economic peaks in 2000 and 2007, when the U rate bottomed and employment growth peaked.
Real labor productivity has decelerated to below 1% since 2011, and the labor force is barely growing, if at all.
Labor’s share of GDP is at a record low, which is contributing to the decelerating rate of marginal productivity of labor.
I suspect that growth of civilian employment peaked last spring-summer and is flattening out before declining sometime in H1.
You don’t see secular slow-motion depression-like conditions, and neither do most establishment economists, because you (and they) are not looking at the data that indicate same, and most economists are not paid to look.
3 out of 5 Americans don’t have enough savings to cover a $500 repair bill or $1,000 ER visit:
https://twitter.com/Reddy/status/552871246049071104/photo/1
Yes, Jeffrey.
The top 1-10% of US households own 40-85% of all financial wealth and receive 20-50% of all US income.
The bottom 80% of US households own 7% of financial wealth and receive 40% of income.
Total health care spending in the US is approaching an equivalent of ~50% of private wages and 170% of corporate profits after tax.
Total gov’t spending is 93% of private wages.
Something has to give, and to date it has been labor’s share of GDP and declining real purchasing power after taxes and debt service for the bottom 90%+.
But for the top 0.01-0.1% to 1-5%, conditions have never been better, reflective of the fact that the system is functioning just as it was designed.
The consequences of Keynesian policies penalizing savings and rewarding consumption. Keynesian materialism creates bad behavior.
Uh, Keynes? Again? Your comment is a portrait in ignorance. Any economic theory which accepts the use of monetary policy in economic management emplots exactly the same tools as Keynesianism except in the case that monetary policy becomes ineffective. The central difference between Keynes and his classical predecessors is that, when efforts to make private saving less attractive relative to spending fail, Keynes resorts to public spending.
I reaize that, for those who don’t feel the need to understand before they accuse, getting Keynes exactly wrong is beside the point. The fact is, however, that you have gotten Keynesexactly wrong. Recession fighting by discourage saving through reducing the return on saving is common to just about all modern schools of economics.
So right and so wrong, simultaneously.
Yes, bond yields are signaling low inflation, the proximate cause of which is significant slack, plus some favorable disinflation from oil. Some smart economists argued that a large fraction of the economic impact of oil price shocks was from the monetary response.
So yes, bond prices are signalling recession!!! The Fed should start buying bonds to push inflation back to 2%!! Now!!
… or at least commit to not raise rates until 2016, at least.
😉
On a serious note, this is a just a rehash of an argument N. Irwin wrote on the Upshot at the end of Nov.
I think it’s excellent news, myself. I completely disagree of course, but some quarters take flavors of this analysis seriously. To some extent you see it in the Fed minutes. I think raising rates in June is a mistake, so I am not inclined to disabuse people of the notion we are seeing aggregate demand weakness. Because we are!
dwb, the Fed cannot raise the funds rate or risk a severe disruption to the term structure of the hopelessly leveraged carry trade for US Treasuries and MBS against equity index futures by TBTE banks’ shadow banks’ dark pools operating virtually unsupervised via offshore pass-through entities with the cooperation of exchange-sponsored HFT to jam equity index futures at optimal technical levels for equity futures.
The leverage of 50-80:1 (much larger than in 2007-08) netted shadow banking positions to bank capital implies that as small as a 1.25-2% loss to leveraged netted “assets” would result in the banking system again seizing as in 2008-09. In turn, given the nature of leveraged fixed income to equity index futures, the Fed/TBTE banks cannot permit more than a 10% decline in major equity index futures that persists without the system being at risk of imploding into another cascading deleveraging and hyper-volatile illiquidity event.
Were the Fed to raise rates, the risk would be a global unwinding of the unprecedented carry trade leverage and a scale of debt- and asset-deflationary wipeout that will make 2008-09 look like an amateur hour rehearsal.
Watch liquidity swaps for early signs of another incipient 2008-09-like illiquidity event.
The Fed will not raise the funds rate in 2015, and likely not do so indefinitely, which is the precedent for the Long Wave debt-deflationary regime. Given the likely bust emerging in the energy sector and the implied fallout for IP, employment, auto sales, and housing, the Fed is more likely than not to resume QEternity later this year as GDP decelerates, the U rate bottoms, employment peaks or declines, and the fiscal deficit increases again for the cycle.
wow, that is a lot of derp all at once, I may have to break it into small bites. You forgot to work in “Ponzi” and “buy gold.” Let me summarize the consequences of the Fed raising rates as I understand it: Disaster! biblical proportions! Real wrath-of-God type stuff! Fire and brimstone coming down from the sky! Rivers and seas boiling! Forty years of darkness! Earthquakes, volcanoes! The dead rising from the grave! Human sacrifice! Democrats and Republicans, living together! Mass hysteria!
sigh, every time the Fed raises rates, people predict banks will fail. If they raise rates too much, you might be right, but not for any of the derpy reasons you listed.
dwb, I’ll add you to the list of not adding to a serious discussion of the topic. Thanks.
US oil consumption growth is running at 4.4%. If we allow 1% efficiency gain next year, you’re looking at GDP growth in the low 5%’s, on this basis.
Steven, take a look at the level and change rate of growth of oil production the energy sector required in terms of oil consumption in order to increase oil production at a decelerating change rate since 2012.
That is to say, while households and the rest of the commercial and industrial sector grew consumption little, if at all, it required the energy sector consuming ~80% of marginal oil production since 2012 to sustain the unsustainable log-periodic, super-exponential growth of oil production during the period, which was the fastest 5-year rate since 1927 and 1937, as well as the fastest 9-year rate since WW II through the Korean War.
Moreover, all of that production and consumption of costlier, lower-quality tight and tar oil occurred in order to extract an accelerating rate of same that the US cannot afford to extract and consume on a 5- and 10-year change basis to allow real final sales per capita to grow.
A regression of US oil production and price implies a decline in US oil production of 2-3MMbbl/day in the years ahead from the current bubbly 9MMbbl/day (which is ~40-45% decline per capita since 1970). Should oil consumption decline proportionally, this will be a decline in oil consumption that matches, or exceeds, that of the decline during 2009-12, and equaling the decline during the early to mid-1980s, which occurred coincidentally with the worst recessions since the Great Depression in both cases.
And this is supported by the historical precedent that when the price of oil declined 40% or more YoY that the US economy experienced recession and an equity bear market of an average decline of 35% going back to the Civil War, with the singular exception of 1986, which was followed by the 1987 Crash.
Allow me to wrap it up by pointing out that US industrial production (IP) since 2011-12 has been disproportionately driven by the boom/bubble in the shale oil and gas sectors and energy-related transport (trucking and rail), including orders and production of capital equipment for the energy and energy-related sectors, not to mention bank commercial and industrial lending to the sectors.
The crash in the price of oil will very quickly result during H1 2015 in energy junk bond defaults, bankruptcies of marginal producers, firings, banks withdrawing lines of credit and rollovers of same, and a breathtaking decline in shale oil extraction/production, employment, and purchasing power of the sector’s labor hereafter.
Whereas the decline in oil production, consumption, and price during the similar period of the early to mid-1980s was stimulative, the debt to wages and GDP today is far higher than 30-35 years ago, suggesting that any presumed stimulative effects to investment, production, and consumption will be remarkably short lived, if not non-existent this time around, implying further that the incipient bust in the energy sector will drag on IP and overall US GDP hereafter.
If one understands Peak Oil, net energy per capita, exergy, the Long Wave, Limits to Growth, population overshoot, and the Seneca Effect/Cliff, which 95-99% of the population do not, the implications for oil extraction, consumption, and real GDP/final sales per capita is no mystery and is following the implied trajectory. Elite business schools and economics departments do not teach this lesson, sad to say; but readers should not presume that it is privately unknown, misunderstood, and not internalized, as no doubt you are one who is similarly informed but has no prospect of being paid to say so.
Meanwhile, depletion marches on:
For purposes of illustration:
Assumptions:
Global C+C (Crude + Condensate) Cumulative Production through 2005: 1,000 Gb
Low EUR Case for Post-2005 Global Cumulative C+C: 1,000 Gb
High EUR Case for Post-2005 Global Cumulative C+C: 2,000 Gb
Global C+C averages 75 mbpd for 2006 to 2015 inclusive (versus 74 mbpd in 2005)
Cumulative Global C+C Production for 2006 to 2015 inclusive: 274 Gb
Low EUR Case Global C+C Depletion Rates:
2006: 2.7%
2015: 3.8%
High EUR Case Global C+C Depletion Rates:
2006: 1.3%
2015: 1.6%
In other words, we are in all likelihood seeing an accelerating rate of depletion in remaining post-2005 Global cumulative C+C production, the only question is the rate of depletion. (The depletion rate is the rate that we consume remaining reserves. Regardless of whether production is increasing or decreasing, depletion is a one way street, and in fact an increase in production is an increase in the depletion rate.)
Incidentally, if we subtract out plausible estimates for global condensate production (which is a byproduct of natural gas production), it’s a virtual certainty that the average global crude oil production rate (45 and lower API gravity crude oil) for 2006 to 2015 inclusive will be below the 2005 production rate. In my opinion, global crude oil production has probably effectively peaked, while global gas production and associated liquids (condensate and NGL) have so far continued to increase.
In regard to oil exports, I estimate that post-2005 Global CNE* (Cumulative Net Exports) are on the order of 470 Gb. I estimate that CNE for the 2006 to 2015 time frame inclusive will be about 160 Gb (an average of about 44 mbpd for 2006 to 2015, versus 46 mbpd in 2005), which would put estimated post-2005 Global CNE about 34% depleted at the end of 2015. And so far, through 2013, the developing countries, led by China, have consumed an increasing share of a post-2005 declining volume of Global Net Exports of oil.
The estimated rate of depletion in Global post-2005 CNE in 2006 would be 3.5%, and the estimated rate of depletion in remaining Global post-2005 CNE in 2015 would be 4.8%. Again, in my opinion the question is not whether we are experiencing an accelerating rate of depletion in remaining Global post-2005 CNE; the question is, how fast is rate of depletion accelerating.
*Combined net exports from (2005) Top 33 net exporters, total petroleum liquids + other liquids (EIA); post-2005 CNE estimate based on 2005 to 2013 rate of decline in the Top 33 ECI Ratio (ratio of production to consumption)
Steven & Other Experts,
Should there be some expected understandable relationship between the monthly average price of Brent and the monthly world petroleum supply excess or deficit related to world demand as reported by EIA. Looking at the EIA December 2010 Short Term Energy outlook monthly data from 2010 to 2014, demand seems to be a unit root process, while the monthly supply seems to be trend stationary. The monthly supply excess or deficit seems to be stationary and there seems to be no relationship between the supply excess or deficit and the change in the price of Brent. An amateur looking for some education and enlightenment.
Well, this has been a huge source of contention in the last couple of months. There are significant gaps between the EIA and IEA / PIRA data recently.
The EIA has indicated that they will issue a clarification on the matter with the next STEO, which I believe in on Monday. The respective balance numbers, as they stand now, are here: http://www.prienga.com/blog/2015/1/9/supply-minus-demand
You are not far from my guess, Steven. And do not forget the upcoming elections, and a Hillary very eager to collect the big price, i.e. the estabilishment needs a success story. As my buddies have told me, Hillary has already employed a couple of personal trainers for extended yoga and fitness lessons, just to make sure she is looking good for the MSM clownery. If the script goes on as planned, a piece of cake for Hillary.
This is all a bit complicated for me, BC.
It comes down to oil field cost and productivity. Liquids production per rig increased by some 35% last year, continuing a trend of productivity improvements seen in the last 3-4 years.
So, I have two shale production cost estimates, for example, for Continental Resources. Art Berman puts long-term breakeven near $90. Goldman (I think it’s Goldman) puts breakeven around $50. So which one do I believe? Guess what, the Saudis are in the same position. And so they’re going to ignore the consultants and let events play out, and then we’ll know what real marginal cost is. But right now, US unconventionals are blowing the doors off, with increased production (to date) essentially acting as import substitution. Hence the pretty trade balance and a strong dollar, to wit, at CR: http://www.calculatedriskblog.com/2015/01/trade-deficit-declines-in-november-to.html
By the way, the incoming trade data are supportive of the “Comfort Zone” thesis I lay out in this post: http://www.prienga.com/blog/2014/12/6/oil-and-the-trade-deficit
The US is going to (already is) an important driver of global growth through its current account, just like old times.
Great employment report. Just shy of 3 million jobs in 2014. Best year since the Clinton administration.
Steven, thanks, as always, for the thoughtful reply above.
WRT employment, it’s interesting that the cyclical change rate of real wages per capita after social insurance contributions (payroll taxes) and household debt service decelerated to the historical “stall speed” in Q1-Q2 2014 and turned negative in Q3, as in 2008, 2001, 1990, 1980-81, 1974, and 1970. The decelerating trend for real wages appears to be continuing into Q4.
Historically since the late 1960s, following this metric decelerating to “stall speed” of around 2% from a cyclical peak (1.6% today), real GDP per capita averaged 0% to slightly negative, i.e., recession, during the subsequent 4-6 quarters.
Today’s conditions similarly occurred in early 2008 and summer 2001 when the cyclical change rates were decelerating below “stall speed” to near 0%, the economy was in recession, and the stock market had yet to roll over and crash. Consumer and investor confidence was near the cyclical highs. Economists did not see the cyclical deceleration to “stall speed” ahead of recession (at least not publicly).
Moreover, similarly, the aggregate of real cyclical change rate of profits after tax, disposable income, and gov’t receipts has decelerated to near 0%, which historically has coincided with the onset of recession, peak in employment, bottoming of the U rate, and an increase in the fiscal deficit thereafter.
At a minimum, it is accurate to state that the real, after-tax income component of value-added output is decelerating to a cyclical rate that historically has occurred at the onset of recessions.
But hyper-financialization of the economy and active Fed intervention means that it’s quite “different this time”, including the ongoing 10-year deceleration of nominal and real GDP per capita to the slowest rate since the Great Depression.
Finally, a note on the current account. Recall that if one accounts for “exports” from US supranational firms to their foreign subsidiaries and “imports” coming from those same subsidiaries or their foreign contract producers, the “actual” effective US trade deficit is much smaller than reported, owing primarily to oil imports. But with US oil imports having collapsed with the surge in shale production, the “actual” US trade situation is effectively in balance.
But even on a real net export basis, US net exports as a share of GDP is trivial and will not add much to US real GDP growth. And with US supranational firms pulling back on foreign direct investment (FDI) from China-Asia and elsewhere, the presumed driver of global growth you anticipate is unlikely to occur, especially with overall growth of global trade slowing to the slowest rate in decades.
http://www.imf.org/external/pubs/ft/fandd/2014/12/constant.htm
IOW, the structural drag on growth from “secular stagnation” of the Long Wave debt-deflationary regime is here to say, and now even the IMF has to admit it.
Yeah man, Jeb Bush gets cold feet.
And Hillary is dancing and takes more yoga lessons, well, someone has to abide.
The rise in Treasurys prices is mainly about weakening inflation expectations, not growth.
China and other Asian EMs are seen to be finally starting to get serious about less polluting, more raw-materials-efficient growth. That weakens the “commodities supercycle” story, which has been one of the biggest drivers of dollar inflation.
US growth expectations remain decent in the 2.5-3 range, but it’s low-inflation growth. Partly for good reasons – technological advances – and partly for controversial or not good reasons – offshoring, downscaling of homes, labor slack.
I’m skeptical of Steven’s uberbullishness. Even if oil consumption grows 4.4%, so what? Growth is about a lot more than driving and trucking and petrochemicals, and I’m not sure the latter are even being helped. (Last I saw miles driven were up 2.6% y-o-y in October, but 4.4 is plausible. If you’re looking at processing volumes, remember exports.)
BC and JBH are too bearish, but they have a point about debt that is important to understanding why 2015 is not 2004 or 1996. Debts are problematic as transfers from likely consumers to likely savers and as financial fragility. Low interest rates have shrunk household debt service payments down to a more manageable level, but those have been rebuilding. All this means interest rate increases will be more self-limiting than usual. But I doubt rates will be raised this year.
There could also be some increased foreign buying of Treasurys in anticipation of dollar strengthening, and maybe improving expectations for budget deficits.
Thanks, Tom. I suspect that most are underestimating the weakness in the cyclical growth (or lack thereof) of real incomes (as well as profits and gov’t receipts) after taxes, debt service (“rentier taxes”), and onerous medical insurance and out-of-pocket costs. A bust in the energy sector will likely catch most economists by surprise by the extent that the bust drags on capital goods orders, IP, vehicle sales, and housing just as YoY comparisons become tougher by Q2. I will not be surprised were trend real GDP per capita abruptly decelerate from ~1.6% today to well below 1% by Q2.
The trend real GDP is ~1.6% for the cycle and less than 1% per capita, and less than 1% peak to peak and near 0% per capita. That fits, of course, with labor productivity and slow or no growth of the labor force. That’s as good as it gets.
And, yes, many economists will be content to laud the conditions as slower but steady growth with low inflation, but they are ignoring the secular deceleration and that such slow growth means slower rate of investment, capital replacement and accumulation, and the Marxian slowing rate of profits that will persist in being a self-reinforcing feedback resulting in ongoing deceleration of real GDP per capita, revenues, wages, profits, and gov’t receipts.
VMT is up 2.6% as you note. Oil consumption is up 4.4%, but that’s over a very short period. Let’s see if it sticks. My own forecast calls for US oil consumption up cc 500 kbpd in 2015, about 2.6%.
I have partial forecasts for all the ‘product supplied’ categories. An interesting question is oil for home heating, which is down by half since 2005. If oil is cheap, will a lot of people just turn up the thermostat? That’s not GDP growth, but it is a lot of comfort. It could happen.
Also, my VMT forecast for 2015 is +4%. I think we’re well on track for that right now. Expect a 1.5% fuel efficiency gain this year, so net 2.5% up for road fuel if my forecast holds up.
Also, airline traffic is forecast up, 8-11%. Big year for airlines. But it doesn’t get any more comfortable to fly. Minimal efficiency gains there, could see efficiency loss of, say, 1%. See the post: http://www.prienga.com/blog/2015/1/9/airline-outlook
You’re right, air travel and all kinds of oil-fueled transport industries should be strong. I just don’t generally buy the “oil = energy = all-important to economic activity” equation that peak oil theorists seem to take for granted. Oil doesn’t directly fuel all that much of the American economy, and it especially doesn’t fuel many kinds of production that scale up quickly, air travel being the exception. In a nutshell tourism should react first, then bigger cars, then longer commutes. I’m not enough of an oil guy to comment on processing for export or petrochemicals. Along the way some of the extra real income from lower oil prices gets allocated to other kinds of domestic production unrelated to oil, and some to other imports and their domestic distribution. I see that oil is big and has knock-on effects, but the idea that growth is some spread over oil consumption growth strikes me as bizarre.
Demand can increase through higher wages or lower prices.
Lower oil prices is a transfer of income from oil producers to oil consumers.
And, lower oil prices, along with slowing the U.S. oil boom, will improve U.S. efficiency in oil production.
However, in general, although inflation has been low, there hasn’t been a transfer of income from profits to prices.
Since 2008, U.S. firms became more efficient, producing output with fewer inputs, to maintain or raise profits.
However, there hasn’t been enough competition to reduce prices, e.g. because of barriers to entry (with market power), regulations (hurting both smaller businesses and consumers), and taxes (including more progressive taxes).
So, we have more efficient producers with less competition, high profits, and too much pricing power.
The rise in corporate profits:
http://research.stlouisfed.org/fred2/graph/?g=cSh
Financial corporate profits to GDP: http://research.stlouisfed.org/fred2/graph/fredgraph.png?g=WKy
Financial profits as a share of total profits: http://research.stlouisfed.org/fred2/graph/fredgraph.png?g=WKA
Change rate of GDP less financial profits: https://research.stlouisfed.org/fred2/graph/fredgraph.png?g=WKC
The cyclical trend rate of growth of non-financial profits have decelerated from 9-10% in the 1980s-90s to less than 3% since the 2006-07 peak:
http://research.stlouisfed.org/fred2/graph/fredgraph.png?g=WKE
Despite the near record to GDP and high margins, the trend rate of growth of profits is decelerating from previous peaks with ongoing record low labor share of GDP, which in turn is dragging on growth of real labor productivity and the trend of real GDP and per capita with little or no growth of the labor force.
This is structural and effectively permanent with the effects of Peak Oil, Boomer demographic drag effects, and fiscal constraints and little or no multiplier hereafter from deficit spending.
The fiscal deficit is set to increase in 2015 with the cumulative effects of the likely deflating of the shale oil and energy-related transport bubble, echo housing bubble, and the subprime auto loan bubble.
BC, you need to see the definition of the financial sector:
“…firms that provide financial services to commercial and retail customers. This sector includes banks, investment funds, insurance companies and real estate.
Financial services perform best in low interest rate environments. A large portion of this sector generates revenue from mortgages and loans, which gain value as interest rates drop. Furthermore, when the business cycle is in an upswing, the financial sector benefits from additional investments.
Improved economic conditions usually lead to more capital projects and increased personal investing. New projects require financing, which usually leads to a larger number of loans.”
http://www.investopedia.com/terms/f/financial_sector.asp
Corporate profits are also high for retailers, homebuilders, high-tech firms, etc., because of efficiencies in production.
You may want to read this article:
Profits Without Production
Paul Krugman
June 20, 2013
“Economies do change over time, and sometimes in fundamental ways.
“…the growing importance of monopoly rents: profits that don’t represent returns on investment, but instead reflect the value of market dominance.
…consider the differences between the iconic companies of two different eras: General Motors in the 1950s and 1960s, and Apple today.
G.M. in its heyday had a lot of market power. Nonetheless, the company’s value came largely from its productive capacity: it owned hundreds of factories and employed around 1 percent of the total nonfarm work force.
Apple, by contrast…employs less than 0.05 percent of our workers. To some extent, that’s because it has outsourced almost all its production overseas. But the truth is that the Chinese aren’t making that much money from Apple sales either. To a large extent, the price you pay for an iWhatever is disconnected from the cost of producing the gadget. Apple simply charges what the traffic will bear, and given the strength of its market position, the traffic will bear a lot.
…the economy is affected…when profits increasingly reflect market power rather than production.
Since around 2000, the big story has been one of a sharp shift in the distribution of income away from wages in general, and toward profits. But here’s the puzzle: Since profits are high while borrowing costs are low, why aren’t we seeing a boom in business investment?
Well, there’s no puzzle here if rising profits reflect rents, not returns on investment. A monopolist can, after all, be highly profitable yet see no good reason to expand its productive capacity.
And Apple again provides a case in point: It is hugely profitable, yet it’s sitting on a giant pile of cash, which it evidently sees no need to reinvest in its business.
Or to put it differently, rising monopoly rents can and arguably have had the effect of simultaneously depressing both wages and the perceived return on investment.
If household income and hence household spending is held down because labor gets an ever-smaller share of national income, while corporations, despite soaring profits, have little incentive to invest, you have a recipe for persistently depressed demand. I don’t think this is the only reason our recovery has been so weak — but it’s probably a contributory factor.”
Peak, the US economy has become hyper-financialized since the 1990s, one of the consequences of which is that annual net flows to the financial sector equal, or occasionally exceed, total value-added output. The financial sector is now exerting an extractive, parasitic effect on productive, wealth-producing activity.
That is to say, the financial sector, and the top 0.01-0.1% to 1% who are the primary beneficaries of the net flows, has/have a claim on virtually all labor product, profits, and gov’t receipts in perpetuity.
The economy outside the financialized sectors cannot grow on a net basis. Consequently, neither can capital formation to GDP grow hereafter with all of the predictable consequences.
Peak, what Krugman is describing without saying so (or realizing it) is the predictable monopoly rentier effects of hyper-financialization and record low labor returns to GDP with record debt to wages and GDP and the resulting extreme (financial) wealth and (rentier) income inequality discouraging productive investment, production, and employment, and thus reducing money velocity and the reflationary effects of monetary policy.
Since the 1980s, when the US experienced the onset of deindustrialization as a result of peak crude oil production per capita and the subsequent 30% decline per capita, and 42% since 1970, the US replaced gains in labor’s share to GDP with increasing (and unsustainable as of 2007-08) debt to wages and GDP that reached a cumulative order of exponential differential growth from the early 1980s. Now growth of public debt to wages and GDP has reached the similar “jubilee” threshold since the 1950s, after which the velocity of gov’t debt and fiscal deficits is below 1.0 and will no longer hereafter provide any GDP multiplier effect apart from preventing nominal GDP from contracting with a sufficiently large fiscal deficit along the way.
Since 2005-08, the world is where the US was in the mid- to late 1970s with respect to oil production per capita, which implies that the world has reached peak industrialization per capita, i.e., as anticipated by the “Limits to Growth” models” and will hereafter experience deindustrialization and decelerating real GDP per capita indefinitely hereafter. But the world does not have the luxury of low debt to wages and GDP and the constant US$ price of oil at $15-$20/bbl as the US (and yet-to-develop world) enjoyed in the early 1980s.
Krugman does not address these global net energetic/exergetic/entropic factors because he either does not know it, does not have the capacity to understand and apply it, and/or is not paid by Wall Street and the rentier-funded Ivy League Establishment to inform his audience.
Peak Oil, demographics, the Long Wave, the hegemonic cycle, and the debt cycle (to wages and GDP) predicted what has happened since 2000 and 2007. What it predicts hereafter is more of the same, including decelerating real GDP per capita; little or no growth of capital formation to GDP; falling labor force participation; continuing record low labor share to GDP; a potential GDP much lower than is assumed; secular trend real GDP/final sales per capita of ~0%; ongoing deceleration of CPI and of money supply (less bank cash assets/reserves); lower long interest rates; more Fed QEternity (as in Japan since the early 2000s); ECB QE; China’s growth of real GDP per capita decelerating from a fictitious ~6% to ~2-3% by decade’s end and near 0% by the early to mid-2020s (owing to a collapse in FDI and exports and increase in energy and food imports to GDP); another global real estate recession; rising fiscal deficits to GDP; and, among other things, little or no real total returns to equities for 7-10 years with the risk of a cyclical drawdown of 35-50%+ in the meantime.
Establishment business, Wall St., and academic economic intelligentsia did NOT anticipate the conditions that the Long Wave implied that have occurred since 2000 and 2007, and neither are they anticipated the ongoing secular progression of the Long Wave debt-deflationary regime and the US, EZ, and eventually China experiencing “lost decades” hereafter.
BC, you continue to ignore the real economy and turn any positives into negatives.
For example, U.S. market power improves U.S. terms-of-trade. So, the U.S. is able to consume more than produce in the global economy and in the long-run. Americans are able to consume more with less effort, because of structural trade deficits and efficiencies in production.
You want Americans to spend and borrow in a depression to generate jobs and raise living standards. So, more Americans can afford to spend and borrow to generate more jobs.
And, when the country reaches full employment, you want to slow growth to a sustainable rate.
The U.S. has enormous productive capacity to expand and raise income = consumption + saving.
There’s no “hyper-financialization.” Instead, there’s massive idle capital earning enough for capital preservation, along with massive idle labor.
So, there’s great potential for the economy to expand., and I’ve explained before how to unleash that growth.
Peak, what many are missing, I suspect, is the extent to which the shale oil and energy-related transport boom/bubble disproportionately affected growth of US industrial production (IP), which in turn created a disproportionately outsized, incremental, unsustainable effect on growth of employment, spending, housing, and vehicle sales from subprime auto loans that otherwise would not have occurred without QEternity, ZIRP, growth of demand in China-Asia and EM.
Google subprime auto loan and energy sector junk bond defaults and the scrutiny now being focused on bank loans by the OCC.
This is late winter to spring-summer 2008 all over again, except rather than subprime real estate loans and leveraged collateralized debt instruments, we have subprime auto loans, student loans, an echo housing bubble deflating, and energy sector and EM junk debt that is poised to implode and compel central banks to print trillions more to avoid an historic debt-deflationary wipeout, another big equity bear market, price deflation, a resumption of the deceleration of nominal wages, and contraction of money supply (ex bank cash) and nominal GDP.
Economists don’t see the prospective risks and outcomes because they are largely financial economists “educated”, informed, and conditioned that central bank printing of fiat digital debt-money bank reserves to encourage financial bubbles and fund fiscal deficits to prevent contraction of nominal GDP is the only answer to flagging aggregate demand per capita, when the actions and outcomes are evidence of unsustainable, non-productive, costly hyper-financialization, which in turn is not a “solution” but a sign of incipient decline or worse.
BC, I agree, the U.S. oil boom had a positive effect on GDP, through production, international trade, and prices (including natural gas).
However, most of the real effects were regional, similar to throwing pebbles in the water causing waves that become increasingly smaller away from the center.
There’s still tremendous idle and underemployed labor and capital for much faster real growth to close the output gap.
We need to raise and then sustain income = consumption + saving to shrink debt as a percent of income = GDP = output.
Peak, potential GDP is much slower (less than 1% real per capita) and the output gap much smaller than is generally assumed, owing to the factors I relate above: record low labor share to GDP; decelerating real labor productivity; little or no growth of the labor force due to net Boomer demographic effects; and others including prohibitive costs of medical insurance and services as a share of after-tax income and GDP, as well as extreme wealth and income inequality resulting in hoarding by the top 0.01-0.1% to 1% of overvalued assets as a share of wages and GDP, resulting in ongoing decelerating money velocity and little or no reflationary benefit to the overall economy, especially for the working-class bottom 90%.
Accelerating automation of paid employment with net replacement and elimination of after-tax purchasing power for a growing share of services employees in the years ahead will exacerbate the effects of the low labor share of GDP, real GDP per capita, revenues, profits, investment, production, capital replacement and accumulation, and gov’t receipts.
BC, see the Krugman article above and the real economy, including its productive capacity.
Peak: “BC, see the Krugman article above and the real economy, including its productive capacity.”
Peak, for the record, not that anyone cares, nor should, but I perceive Krugman as most relevant to what Krugman thinks, not what is actually happening in the transformation of the hyper-financialized economy within the larger context of the Long Wave Downwave/Trough and debt-deflationary regime, which Krugman would likely not even acknowledge, assuming he is sufficiently informed, which I doubt.
Krugman’s role as “liberal”, Ivy League economist, sophist, and apologist for the status-quo, business-as-usual, Wall Street-dominated narrative.
Given what we face as a consequence of Peak Oil, population overshoot, peak Boomer demographic drag effects, “Limits to Growth”, hyper-financialization and debt and overvalued assets to wages and GDP, accelerating automation of service labor and loss of purchasing power without replacement, and onerous rentier claims of the top 0.01-0.1% to 1% on labor, profits, and gov’t receipts in perpetuity, I would go so far to assert that Krugman is effectively irrelevant to being no more valuable than a well-paid, oft-quoted, useful idiot (fully conscious of same, and G-d bless ‘im) for the rentier Establishment.
And additionally for the record, I’m no less an idiot than Krugman but far less useful to the rentier Establishment, while being rather poorly compensated, comparatively, despite my efforts here and elsewhere around the world; curious, that.