We are fortunate to present today a Guest Contribution written by John Kitchen (U.S. Treasury). Any views or opinions expressed are solely those of the author and not of the Treasury Department or any other institution.
With the recent declines in valuations in financial markets, an analysis based on “Relative Valuations of Fixed Capital and Financial Assets in the United States” indicates that we are in a “gray area” regarding the signaling of a heightened risk of recession.
The recent volatility in financial markets and equity valuations may be a reminder of a lesson economists and policymakers learned from the financial crisis and great recession: that they didn’t fully understand the relationships from the financial sector and financial valuations to real macroeconomic variables and overall economic performance. The paper “Relative Valuations of Fixed Capital and Financial Assets in the United States” uses data from the integrated macroeconomic accounts (IMA) from the Bureau of Economic Analysis and the Federal Reserve to provide more information — and at least an initial effort — for better understanding relationships between the real economy and financial valuations. The analysis examines the various layers of the relationships of asset valuations relative to potential GDP for the private nonfinancial sectors of the U.S. economy, building up from the relative valuations for fixed capital assets (the capital stock), to the relative valuations for total nonfinancial assets (including land), and then to total assets (i.e., including financial assets). Just as the name of the data set from which the information for the paper is drawn implies, the financial and real economy data are fully integrated in the analysis.
While many issues are addressed in the paper, including the observed relative stability of the aggregate capital-output ratio (consistent with a Kaldor “stylized fact”) and the observed volatility of relative financial valuations, one part of the paper addresses the observed cyclical performance of asset valuations and the role as a leading indicator for the economy’s business cycle. In that context and based on historical relationships, the recent declines in equity valuations indicate that we are currently in a situation of somewhat heightened risk of a recession – but at this time it is in a “gray area” that does yet outright indicate a recession compared to what has been observed historically. (Note the financial variables are leading indicators in contrast to the coincident variables recently addressed by Menzie Chinn.)
That conclusion is based on two parts of the analysis of the paper: (1) threshold analysis that looked at the changes (declines) in total asset valuation (relative to potential GDP) that historically were associated with a subsequent recession in the economy; and (2) simple probit analysis for the univariate relationship for the change in total asset valuation to a binary recession indicator (i.e., generating a recession probability estimate based solely on the observed changes in total asset valuations).
Using those relationships and an assumption for financial and equity valuations for the first quarter to be consistent with an S&P500 value of 1877 (Monday’s close), what would that imply? Regarding the total asset valuation, the following chart shows that total asset valuations are behaving suspiciously like they have at previous asset valuation peaks preceding business cycle peaks and recessions.
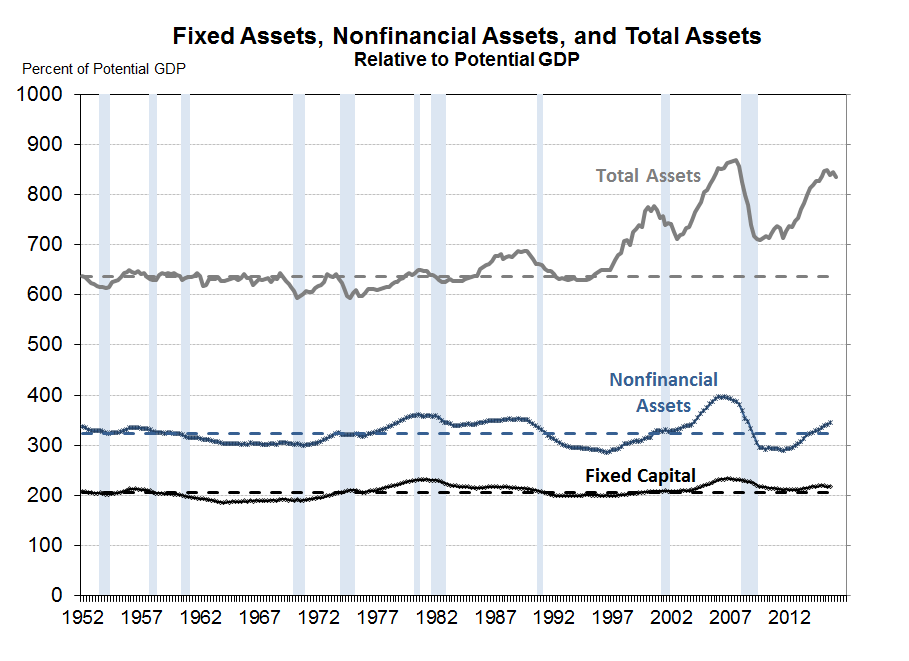
With the further decline in asset values in the first quarter, the two-quarter decline in total asset values would be 0.7 percent and the three-quarter decline would be 1.7 percent – which as discussed in the paper are, relative to historical occurrences, at the threshold of observed prior “no turning back” occurrences for financial peaks and declines prior to recessions.
Regarding the univariate recession probability estimate, the relationship also suggests some heightened risk. The following chart shows the estimates for a probit regression of the binary recession indicator on the current and three lagged values for the change in total asset valuation (the regression results are shown in the paper but the chart shown here is not).
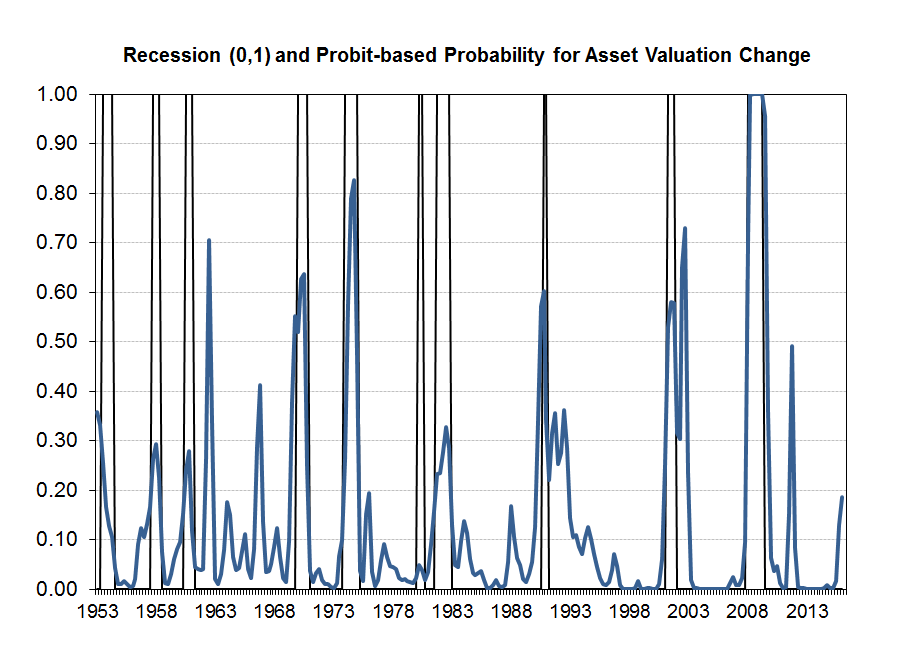
The estimates indicate that the current asset valuation change yields a recession probability of about 19 percent. While there have been various observed “false” signals historically, for periods “sufficiently removed” from a recession period it is rare to see an estimated probability of recession from this indicator this high without subsequently entering recession. The notable exception is for 1966 – and some analysts would agree that a subsequent recession in that case was perhaps the correct call. In various cases in the past, the estimated probability was in roughly the 30 percent to 70 percent range prior to recessions, and only twice did it exceed 80 percent. So, while the predictive ability of the measure is somewhat imprecise, it does suggest somewhat heightened risk.
Bottom line: Declines in equity markets and total asset valuations are flashing warning signs, but are not yet at this time providing an outright indication of recession.
This post written by John Kitchen.
Interesting post. Thank you.
A couple of comments:
The parallel with the current situation is the post-1986 period, at least with respect to oil. And we did indeed see a financial crisis in 1987, the S&L crisis. According to Wikipedia: “A virtual end of inflation in the American economy, together with overbuilding in multifamily, condominium type residences and in commercial real estate in many cities. In addition, real estate values collapsed in the energy states – Texas, Louisiana, and Oklahoma – particularly due to falling oil prices – and weakness occurred in the mining and agricultural sectors of the economy.” Once again, we have an energy recession (although, did anyone notice the North Dakota’s unemployment rate fell to 2.7%, the best in the nation?)
Is the US today a large, open economy, or a small, open economy? The Chinese seem to be able to toss around the DOW with ease. Thus, comparability between current events and the historical record may not be entirely apt. Domestic drivers may no longer be key.
Any bubble seems entirely limited to financial assets.
Finally, note the crypto recession of 2011 (ECRI’s blown call in the US, a 2+ year recession in Europe).
Nodaks unemployment has not spiked is because nearly all of oilfield workers in the state are commuters. The rate in Texas has been going up rather quickly the past few months. I’m not sure why you shrug off the bubble as entirely limited to financial assets. Look at CLR’s recent announcement to cut CAPEX 66% next year and it still cannot be cash flow neutral at current prices. That companies Q4 report in Feb will be so bad it would almost be funny if it didn’t mean lots of people losing their jobs. I’m talking $6 bil+ writedown on its real and tangible assets underground. The scary thing is companies like this are the rule rather than the exception in the energy industry. The fact of the matter is that financial assets are there to represent claims to real things. The rising spreads in junk bond rates represent the fact that investments were made in large amounts into real, physical things like $10MM wells that will never pay back.
Welcome to my world.
As for Texas, the unemployment rate is 4.7%, up from about 4.2% six months ago. So Texas with a recession is still better than New Jersey, and way better than California at 5.8%.
“The estimates indicate that the current asset valuation change yields a recession probability of about 19 percent.”
“It is rare to see an estimated probability of recession from this indicator this high without subsequently entering recession.”
So which is it? 19% or nearly 100%? How do you square these two very different statements?
Current/recent valuations indicate the 19% … but it is “rare” that subsequent changes in valuations (further declines) wouldn’t occur once declines of this magnitude have already occurred. But we have not yet seen such subsequent declines, and can’t automatically assume they will happen …
Dr Kitchen:
Thanks for the excellent analysis. I thought that this sentence was a marvel of academic understatement: “The recent volatility in financial markets and equity valuations may be a reminder of a lesson economists and policymakers learned from the financial crisis and great recession: that they didn’t fully understand the relationships from the financial sector and financial valuations to real macroeconomic variables and overall economic performance.”
An excellent macroeconomics professor I had at Wharton in the 1980s continually harped on distinguishing between “the stock, and the flow”. Part of the confusion, perhaps, is that traditional economic analysis focuses primarily on the flow of income variables quarter-to-quarter, and maybe doesn’t pay enough attention to the stock of asset (and liability) values. Including debt.
Ray Dalio of Bridgewater is the most successful hedge fund manager of the last 20 years and is a very thoughtful person.
He wrote an essay for The Financial Times this week – the URL is at the bottom – which notes:
” . . . . there are two important cycles to pay attention to — the business cycle, or short-term debt cycle, and the debt supercycle, or long-term debt cycle . . . . . . . We are seven years into the expansion phase of the business/short-term debt cycle — which typically lasts about eight to 10 years — and near the end of the expansion phase of a long-term debt cycle, which typically lasts about 50 to 75 years . . . . . [While the business cycle appears to demand tightening] . . . . It is because of the long-term debt cycle dynamics that we are seeing global weakness and deflationary pressures that warrant global easing rather than tightening.”
In my experience, traditional economists do not believe debt matters – maybe starting with Modigliani & Miller’s classic corporate finance theory which claims that when there are no taxes and capital markets function smoothly there’s no difference between debt and equity – expanded into global macroeconomics suggests that debt doesn’t matter, since every debt liability for one party is an investment asset for another party, and so in sum it all nets out to zero and doesn’t matter . . . . . . .
Myself, I don’t think that Reinhart and Rogoff’s study went far enough in explaining and detailing the deflationary pressures of high debt levels.
http://www.ft.com/intl/cms/s/2/b41813dc-c028-11e5-846f-79b0e3d20eaf.html?siteedition=intl
Current/recent valuations imply the 19% … but it is “rare” that subsequent further changes (declines) wouldn’t occur given the declines already observed; but we can’t automatically assume that such additional declines will occur in the current situation …
Steven, during the energy bust of the 1980s, US debt to wages and GDP was much lower than today;
health care to GDP was half today’s level;
there was a large demographic tailwind from peak Boomers just getting underway (vs. the converse today);
interest rates were much higher and thus a setup for a large reflationary effect from falling nominal interest rates thereafter;
real GDP per capita was 2-3 times faster than today’s rate;
the 6- and 12-year average P/Es for the S&P 500 were 10-13 vs. 19-25 today; and
deindustrialization (offshoring, labor arbitrage, “globalization”, etc.) and financialization of the economy had not yet fully begun.
That the US economy has become hyper-financialized, i.e., total annual net flows to the financial sector now absorb all annual valued-added output, the financial markets are the economy, and asset deflation (a bear market) is by definition recessionary.
The broad US equity market is in a bear market, therefore, the hyper-financialized US economy probably entered recession in Q3-Q4 2015.
Agree with BC 100%. 1986 was nothing like the present – the collapse in oil prices led to an astonishing decline in long-term interest rates that was highly stimulative.
More than 200 basis points worth – and long rates had been falling steadily previously . . . . . .
http://tinyurl.com/jfyvhx2
We can eliminate all future recessions , in fact , we may never have to even work anymore , by simply making our government guarantee the value of assets ( i.e. the net worth of the rich ). A prominent economist has proven this , using the well-known , completely unimpeachable ” Granger Causality” econometrics :
“The stock market Granger Causes Unemployment. Now confirmed in Germany ”
https://twitter.com/farmerrf/status/692054881989849088
Hooray !
https://research.stlouisfed.org/fred2/graph/fredgraph.png?g=3gly
BC –
We’ve added maybe 1 million jobs in the last quarter or so. To suggest that GDP is falling under such circumstances implies negative productivity growth. Not sure I see that.
Steven, I contend that employment is overstated. Were payrolls/employment to be growing at the reported rate, real GDP would typically be growing at 3.25-3.5%, not less than 2% for the 4-qtr. SAAR through Q4 2015.
Core retail sales and Redbook data confirm the sub-2% real GDP.
Look at final sales less the deficit vs. payroll receipts and payrolls and wages and salaries, and the implication is that employment is overstated by as much as 1% on a 12-month-average basis; but this is not atypical at this late stage in the business cycle. Employment data will be revised lower long after a recession has already begun.
No, BC, you’re contending more than that. You’re arguing that employment must actually be declining, or that productivity is declining faster than employment is rising. That’s hard to argue, I think.
By the way, great housing numbers out today; SAAR auto sales may reach 10 year high.
http://www.calculatedriskblog.com/2016/01/comments-on-december-new-home-sales.html
http://www.calculatedriskblog.com/2016/01/vehicle-sales-forecast-sales-to-reach.html
http://rismedia.com/2015-08-25/foreign-investors-rush-to-snap-up-u-s-housing/
http://www.realtor.com/news/trends/top-20-markets-for-international-buyers/
http://effectivedemand.typepad.com/ed/2016/01/duy-brains-no-explode.html
https://research.stlouisfed.org/fred2/graph/fredgraph.png?g=3h32
https://www.businesscycle.com/ecri-news-events/news-details/economic-cycle-research-ecri-grand-experiments-that-are-too-big-to-fail
https://ycharts.com/indicators/us_household_formation
https://app.box.com/s/tme238unt02xoykgyrx0jr2knvub5gkc
Peak Millennials’ entrance into the labor and housing markets as a share of population, labor force, and households is at a Kuznets-cycle rate of 0.75% vs. 3% for the GI Generation and 2.1% for peak Boomers.
https://research.stlouisfed.org/fred2/graph/fredgraph.png?g=38vW
ECRI’s estimate of 1% growth is ~0.3% per capita for potential real GDP per capita, which fits with implied and observed trend growth.
Every business cycle is different. Monetary policy is still highly accommodative and the tightening cycle will proceed slowly. Commodity prices, including oil, have stabilized, after the steep fall, and will begin to rise. Employment growth will continue with faster wage growth.
It’s more likely GDP growth will accelerate this year, perhaps above 3% real growth, barring unexpected negative shocks.
Hi Professor,
How many months do you think the peak in total assets lead the start of the recession historically?
Table 1 of the paper (link is in body of post) shows the historical (since 1968) asset value peaks and troughs and the business cycle peaks and troughs and the number of quarters for the lead in each case and the averages — on average the asset value peak leads the economy’s business cycle peak by 3.3 quarters …
The relationship between total assets and potential GDP looks remarkably stable prior to about 1997. Do you expect a return to the norm? Why did assets “jump the rails” in recent years?
Beyond the role of equity valuations the paper has some discussion about the role of an aging population and increased retirement and pension assets and saving
«The relationship between total assets and potential GDP looks remarkably stable prior to about 1997. Do you expect a return to the norm? Why did assets “jump the rails” in recent years?»
That’s the big deal isn’t it? If one looks at most “long term” stats many show a remarkable change of trend in the mid-1990.
My guess is that “total assets” in the above graphs is a good proxy for “total debt”. And total debt has been shooting up tremendously since the 1990s. My best guess is that after the return of a Republican majority in the House with Gingrich’s “Contract on America” the ongoing asset stripping mania has meant rising leverage ratios, and every time they look like shrinking, dragging down the prices of assets bought on margin, the Fed does a giant round of free debt to support debt security prices, as debt securities are used as collateral through the financial system in place of capital.
This even longer term graph is quite interesting in the context of this post:
http://www.creditwritedowns.com/2011/09/total-private-market-debts-decline-should-be-a-glaring-warning-sign.html
John Kitchen: Excellent addition to the toolkit of leading indicators of recession! This because it is sourced in a different economic/financial fundamental than most leading indicators (e.g. stock market, etc.). And because at first blush it appears that it will be statistically independent of other indicators to a significant enough degree that it will add value. Here is the meat of the argument at the current moment: … for periods sufficiently removed from a recession period it is rare to see an estimated probability of recession from this indicator this high without subsequently entering recession.
I concur with what your indicator is telling us. On the basis of much data work, informed by many years of successfully calling recessions in advance with never a false signal, expect the first month of recession to be somewhere between April and August.
https://research.stlouisfed.org/fred2/graph/fredgraph.png?g=3h5P
https://research.stlouisfed.org/fred2/graph/fredgraph.png?g=2HN3
I liked this chart cribbed from Mark Yusko of Morgan Creek Capital via Business Insider:
http://tinyurl.com/jzokg7d
There seems to be this attitude that we can’t have a recession because employment is so great . . . . but employment is always great right before a recession strikes.
Because employment is a lagging indicator.
Btw, CAT’s 4Q sales reported this week were down -23%. Kind of a staggering revenue decline for a huge multinational company that employs over 100,000 people.
One additional point about employment and GDP, from the Van Hoisington 4Q 2015 report:
“Other important economic indicators reported outright contractions last year. Industrial production slumped 1.4% over the first eleven
months of 2015, with a drop of 2% outside of the automotive sector. Only about 10% of private payroll employment is accounted for in the
manufacturing sector. This fact distorts the true impact of this critical part on GDP. According to the Federal Reserve Statistical Release on
Industrial Production, the industrial sector accounts for about one quarter of real GDP on a value added basis.”
So, my contention is that the manufacturing sector which only has 10% of private payroll employment but accounts for the most cyclical 25% of GDP on a value-added basis has entered recession or is on the edge of about to. Looking at details in the flash GDP report for 4Q 2015 this morning, it’s clear from year-over-year changes in Real Personal Consumption Expenditures (PCE) and Real Final Sales that everything is decelerating:
PCE, quarterly percent changes year over year, Q1 through Q4 2015: +3.3% in Q1, +3.3% in Q2, +3.1% in Q3 and +2.6% in Q4
Real Final Sales, quarterly % change yr-over-yr, Q1-Q4, 2015: +2.4%, +2.5%, +2.1% and +1.9%.
Myself, I’m not alleging that we’re in a recession at this instant – but we are teetering on the edge of a recession and the FOMC is happily raising rates. Conventional economic wisdom believes that with FF and IOER at 0.25%-0.50% that policy is accommodative – as a professional investor with 30 years of experience in hand, I’m on the other side of that trade – the change in policy is tightening credit market conditions (see the spread of high yield to treasuries, for instance) and so the monetary impact on the real world is restrictive . . . . . . . . . Cue: Train Wreck scene.