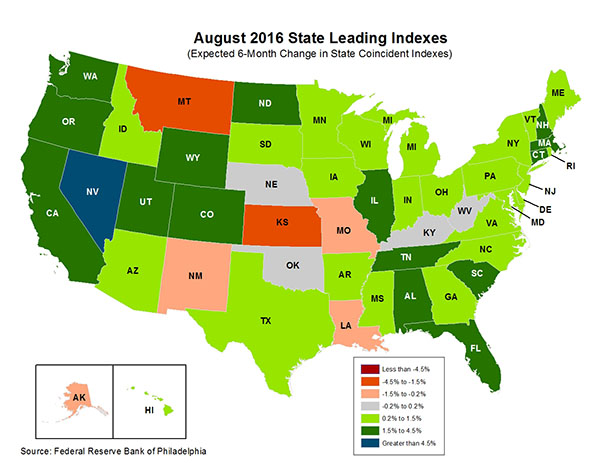
The Philadelphia Fed today released leading indices for the 50 states and the US. Kansas records the largest projected six-month decline in activity (after recording the largest in the Nation three month decline through August).

Source: Philadelphia Fed leading index page.
Even though Montana looks like it might be in close running with Kansas, the projected six month Montana decline of 1.52% is noticeably smaller than the Kansas projected decline of 2.51%.
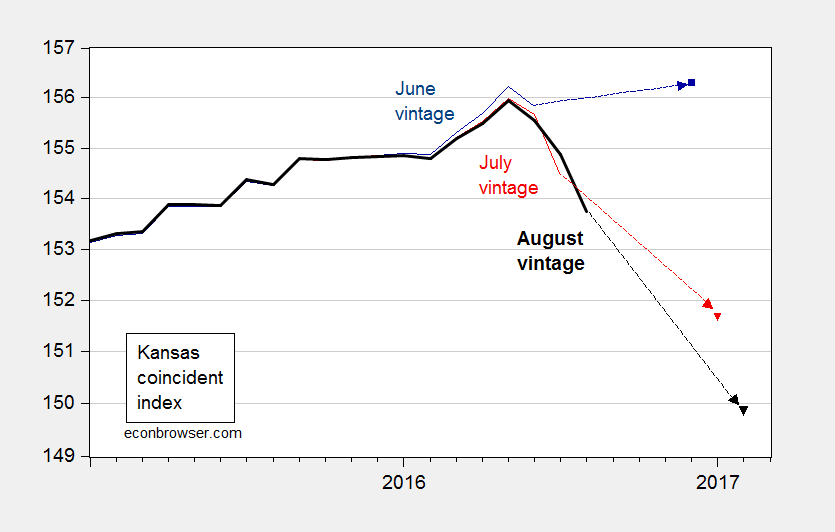
Depicted below is the recent history of data revisions to the Kansas coincident index, and accompanying projections of growth six months out. The pattern seems toward steeper downward trajectories in forecasted activity.
Figure 1: Kansas coincident indices, June vintage (dark blue), July vintage (dark red), and August (black); December 2016, January and February 2017 observations are implied levels from leading indices. Vertical scale is logarithmic. Source: Philadelphia Fed, various vintages, and author’s calculations.
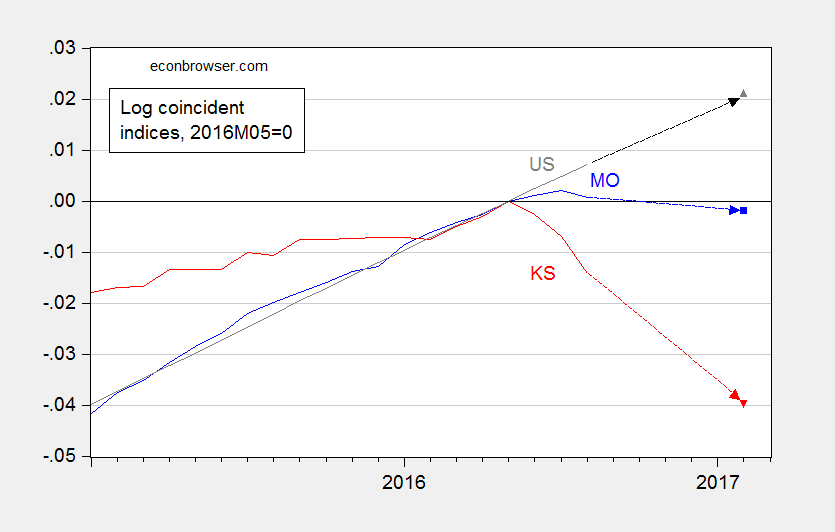
Note that Kansas’s neighbor, Missouri, has also recorded a deceleration in growth — but nowhere near the extent that Kansas has.

Figure 2: Log coincident index for Missouri (blue), for Kansas (red), and United States (gray), all normalized to 2016M05=0; February 2017 observations are implied levels from leading indices. Source: Philadelphia Fed, various vintages, and author’s calculations.
Expanding the sample backwards in time would emphasize the fact that Kansas growth decelerated relative to Missouri around mid-2013.
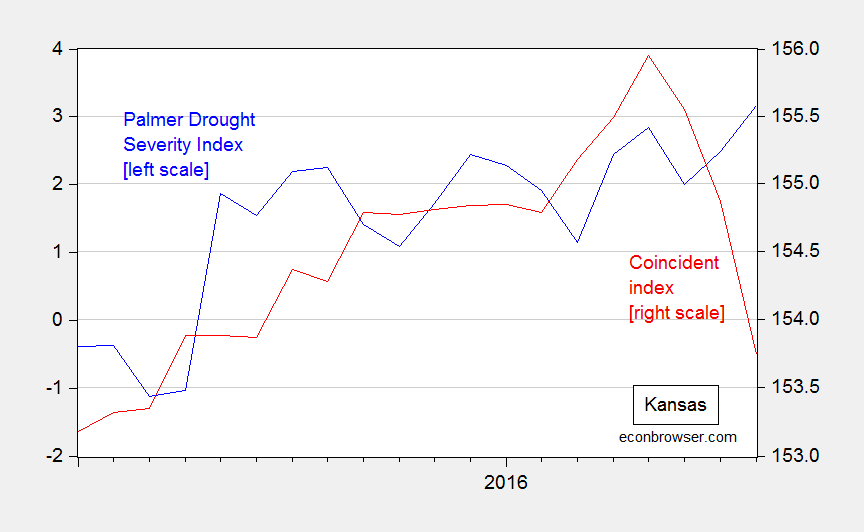
An interesting observation is that the decline in economic activity occurs against a backdrop of improving weather conditions, as measured by the Palmer Drought Severity Index for Kansas.

Figure 3: Kansas Palmer Drought Severity Index (blue, left scale), and Kansas coincident index (red, right log scale). Lower PDSI values indicate drier conditions. Source: NOAA, Philadelphia Fed.
Even if one allows for lags of up to nine months for weather to affect economic activity (recalling further that agricultural output accounts for less than 5% of Kansas GDP), economic activity is declining while weather is improving. This observation is consistent with my view that other forces — including policy — are driving the direction of economic activity in Kansas.
