Or, the continuing investigation of how drought does not explain the Kansas economic debacle, using conventional econometric techniques.
In commenting on this analysis of Kansas GDP trends, reader Rick Stryker asserts the Kansas drought indicator can be best characterized as stationary, and argues treatment of that variable as nonstationary can lead to misleading inferences. He then concludes my ECM “results are illegitimate”. Here, I re-estimate using an ARDL specification robust to such a possibility (interested readers can consult these results to decide for themselves whether the Kansas PDSI is best treated as nonstationary). I find drought is not a statistically significant determinant of agricultural output, nor an economically substantial determinant of Kansas economic output.
Kansas Agricultural Output
Using the default automatic selection procedure in EViews, the optimal relationship estimated between agricultural output (AGR, real value added in Ch.2009$) and the Palmer Drought Severity Index for Kansas (PDSI) is:
AGRt = 1182.4 + 0.688AGRt-1 + 12.483PDSIt
Adj-R2 = 0.45, N = 44, SER = 591.7, number of models evaluated = 20. bold face denotes significance at 10% msl.
The Kansas PDSI coefficient is not statistically significant. The results do not differ if agricultural output is entered in log terms (all regression output here.)
The Kansas Malaise and Drought
What about log real Kansas output (gdpKS) and the relationship to log real US output (gdpUS), and the Kansas PDSI? In that case, the drought variable coefficient is again not statistically significant. And controlling for Kansas government output, as well as the real value of the US dollar? Then one obtains:
gdpKSt = 0.708 + 0.582gdpKSt-1 + 1.070gdpUSt – 0.741gdpUSt-1 + 0.002PDSIt – 0.003PDSIt-1 – 0.001PDSIt-2 + 0.001PDSIt-3 + 0.376govt + 0.103govt-1 – 0.217govt-2 – 0.027rt
Adj-R2 = 0.96, N = 43, SER = 0.008, number of models evaluated = 2500. bold face denotes significance at 10% msl using HAC robust standard errors.
The fitted and dynamically forecasted values of Kansas GDP are shown in Figure 1.
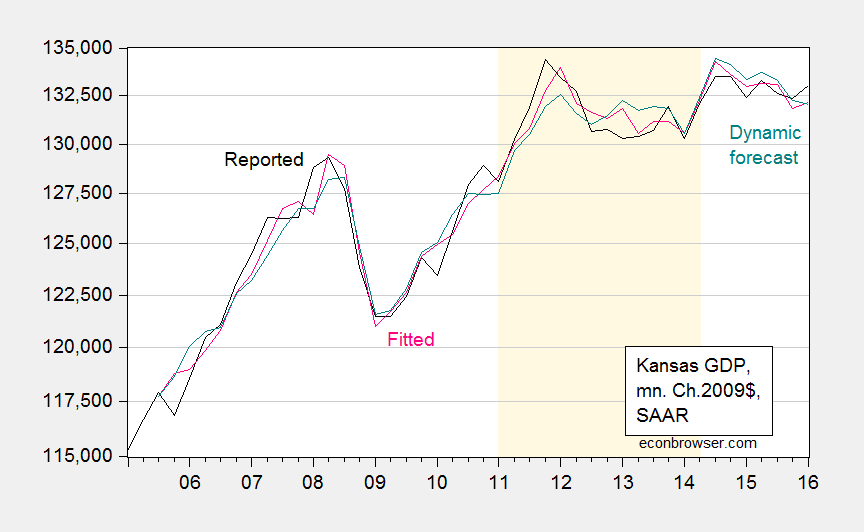
Figure 1: Kansas GDP (black), fitted (pink), dynamic forecast (teal). Drought dates as suggested by Political Calculations (light brown). Source: BEA, and author’s calculations.
Only the third lag of PDSI is significant; contemporaneous government output is also significant. Since the two variables have different ranges, then it’s hard to compare the impacts directly. One way to do this is to use standardized, or beta, coefficients. The (statistically significant) PDSI and government coefficients are 0.09 and 0.25, respectively, suggesting the impact of the latter is greater.
Counterfactuals
Another way to compare the relative importance of drought and government output in determining Kansas GDP is to do a couple of counterfactual exercises using the estimated equation. In Figure 2, I show the counterfactual output level holding the Kansas Palmer Drought Severity Index at 2010Q4 levels from 2011Q1-2014Q2 (red line) and government out at 2011Q1 levels (blue line).
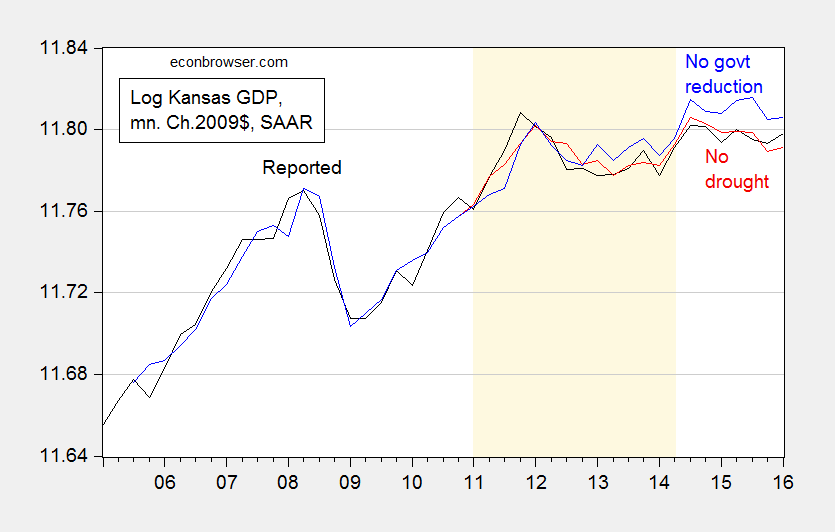
Figure 2: Log Kansas GDP (black), fitted values without drought (red), and without government output reductions (blue). Drought dates as suggested by Political Calculations (light brown). Source: BEA, and author’s calculations.
Over the period identified as a drought by Political Calculations, the impact of reduced government spending is larger than that of drought. I would say this is not too mysterious, given that agricultural output was only 4.5% of total in the last quarter before the drought began.
Conclusion
If you believe the Kansas drought variable is better treated as a unit root process, drought does not substantially explain the Kansas downturn (see here). If you are agnostic about the Kansas drought variable, drought does not substantially explain the Kansas downturn. The downturn in government output better accounts for the Kansas downturn.
And of course, it is hard to appeal to drought as the cause of the recent downturn in Kansas economy, given the improvement in weather conditions since the beginning of the year, as documented here.
To be academically honest, you should be including Colorado in your analysis. It has a law, TABOR, that has been implemented since 1994 (as opposed to the laws you look at in WI and KS which have been implemented for less than 10 years, which is nothing when it comes to most government policies), that has successfully diversified the state away from a single industry (oil & gas) to many industries. So much so that the state has not felt an impact from lower oil and natural gas prices over the past 18 months. Tabor makes Colorado probably the most Libertarian state in the country.
Given that you are a political pundit like Krugman (who you are proud to be compared to), I understand why you only look at states that support your bias. But from an academic/analytic point of view, it sucks that you do so!
Anonymous: I’ve already done it, actually just three months ago. See this post.
Adding a line to a graph is not the same as adding a state to your analysis. But I get it, CO does not conform to a liberal bias, so why discuss it in your analysis?
Anonymous: There is actually a serious literature (i.e., statistical analysis, as opposed to mere kvetching) that suggests that MO is a good comparator for KS at the business cycle frequency; see Crone (2004, published 2005 in REStat), Magrini et al. (2013).
This is not surprising — the structure of production in Kansas matches Missouri more than Colorado. For instance, manufacturing is 15.1% in KS, 13.1% in MO, 7.3% in CO.
Take a look at Venezuela. That is where socialism heads you.
Do you really think there is any analytical reason why leftism would make the economy better? Oh…have fun with your cherrypicking though.
What a joke. And no. Doing a logarithm and some least squares doesn’t make it all science-y. What you really have are isolated examples, digital before/after datapoints (very low degrees of freedom–don’t kid yourself with time series–I could divide it to the second and it wouldn’t be more data versus the experiment on/off). Oh…and a gazillion confounding variables, since it is a social science.
Badgertuff: I can only imagine how you do statistical analysis…
4:12 AM…
Someone was hitting the bottle rather hard.
I gather the drought index relies on temperature and precipitation data to estimate relative dryness and the index varies between -10 to +10.
I do not understand why quarterly data is used if farmers are harvesting crops during a specific season as opposed to harvesting crops all year long.
Should not the drought index data be summarized for the growing season and then annual changes in agricultural output be regressed on annual changes in the drought index?
Menzie,
It seems that you now agree with Ironman’s point, at least partially. That’s progress.
Let’s recap the controversy. You started by denying that drought had anything to do with Kansas’s relatively slower growth by appealing to ocular econometrics in Figure 3 of your linked post. You followed up by estimating an error correction model in which, interestingly enough, you treated the Palmer Drought Severity Index as stationary, keeping it in your equation in levels. You supported this stationary treatment by saying “Log Kansas and US GDP appear I(1) (fail to reject Elliott-Rothenberg-Stock unit root test) and Kansas PDSI (borderline) rejects a unit root.” The coefficient in levels on the PDSI was insignificant and so you concluded that drought had no influence.
Ironman’s complaint was that the drought in Kansas had to be at least part of the explanation for the relatively slower growth, a very reasonable point a priori. He went farther than that to assert that it had to be a “significant” part of the explanation, although Ironman didn’t define what he meant by significant. That point needs analysis to confirm of course. Ironman supported his claim that drought had to be a part of the explanation by doing a simple regression of Kansas Agricultural output on the PDSI, finding a statistically significant result.
At this point, you escalated to Defcon 1, accusing Ironman of perhaps the worst insult in econometrics–that he had estimated a spurious regression. For that claim to be true, both Ag output and the PDSI had to be non-stationary. That’s when I got involved.
Initially, what made me suspicious about your analysis was that the drought index was significant but with the wrong sign, so that the data is saying that more drought stimulates the economy. How can that be true? It is very well-known that drought is bad for agriculture, which is a major industry in Kansas. That strange result suggests that we should suspect a misspecified model. I then looked at the drought index and wondered how it could be non-stationary as you were then claiming. I collected the data and did my own tests and indeed the series looked stationary. Interestingly, despite all my evidence to the contrary, you spent much of the comments in that post trying to claim the PDSI was non-stationary, even though you claimed it was stationary in the previous post I linked to. My point was that your claim that Ironman ran a spurious regression was most likely wrong, since at least one of the variables is stationary. Moreover, the consequence of treating at least one stationary variable as non-stationary in your cointegration analysis was that it likely resulted in a misspecfied model.
In your current post, I think your follow a sensible strategy to use Pesaran and Shin’s ARDL methodology given that we can’t be sure about the stationarity of some of the variables. Your results in this case are much more plausible. I would have expected the lagged value of the PDSI variable to be significant with a positive sign just from the nature of what you are modeling. Crops take time to grow, be harvested, go to market, and then be counted in GDP. It’s not crazy to think that drought would affect the agricultural component output with a lag. Your current results validate Ironman’s claim that drought is at least some of the explanation. But is drought a “significant” part of the explanation?
We can’t tell from your results. Drought is exogenous but government spending is endogenous. We can’t really compare the relative magnitudes in a case in which we can attribute causality to drought but not to government spending. The bottom line is that your results now support Ironman’s original claim that drought is part of the explanation. And your results don’t show that he’s wrong that it’s a significant part of the explanation.
Rick Stryker: Let me remind you that Ironman used a vintage of agricultural output that was subsequently revised substantially downward. Using his measure of agricultural output, ADF and DF-GLS (ERS) fails to reject the unit root null. So too does the ERS point optimal test (all cases using default). KPSS rejects (constant, trend). So at best he is regressing a nonstationary series on a stationary series. Does the resulting coefficient converge to anything in particular?
PDSI fails to reject all the unit root tests (constant, trend), and yields a KPSS stat of 0.096 when the 10% critical level is 0.119 (constant, trend) — which is why I said borderline reject (you were did a monte carlo for critical values for constant specification).
So I think it is not unreasonable to say we’ve possibly got a spurious regression outcome. At best, it’s a regression of nonstationary on stationary series.
Are you saying regressing a I(1) series on an I(0) is going to lead to useful inferences?
I would say that your characterization of Ironman’s assessment is not quite accurate. He was quite vehement that it was weather, aerospace spending reductions, pretty much anything besides government reductions. All I’m saying is that drought does not pop up easily (here’s a puzzle — drought doesn’t show up in determining agricultural output in the ARDL specifications — I didn’t see you comment on that).
Menzie,
But I don’t see why you would assume that PDSI is a trending variable in the KPSS test. The Kansas environment is getting noticeably wetter or dryer over a 10 year period? I assumed the non-trending specification in my test and in the monte carlo simulation, yes, because that seems the most plausible assumption.
I’ve already acknowledged previously that the regression could be unbalanced and that that would be a meaningless regression. I acknowledge that an unbalanced regression has many of the same problems practically speaking as a spurious regression. In a spurious regression, with two non-trending non-stationary variable, the coefficients and R2 are random variables and the t statistic goes to infinity asymptotically. Thus, the beta coefficient will tend to look more and more significant as the sample size increases. In the unbalanced case, a regression of an I(1) on an I(0) variable, the beta coefficient will also be a random variable. However, the t stat won’t go to infinity but will rather converge to a non-standard distribution. That will be a problem since the test will tend to be oversized relative to the assumption of asymptotic normality and if the I(0) variable is near unit root, it will be severely oversized. So, it’s the same misleading inference problem as in a spurious regression. On the other hand, R2 will converge to 0, so you should be able to detect the problem in an unbalanced regression of this sort with enough data, whereas it’s harder in the case of a spurious regression. In finite samples though, an unbalanced regression could misleadingly look like it’s legitimate when we know there can be no relationship between variables of different orders of integration.
Rick Stryker: Why would you assume in a small sample PDSI is mean reverting? See Figure 3 in this new post.
In any event, I am glad you agree that Ironman ran the wrong regression.
Rick Stryker
It is very well-known that drought is bad for agriculture,
It’s more complicated than that. Sometimes drought is very good for agriculture (e.g., the 2-3 months after the crop quits growing). Drought is also very helpful during planting season. For example, corn farmers like dry weather mid-April to mid-May because it allows them to get the crop in the ground sooner. As a rule of thumb, corn farmers lose about one bushel per acre for every day after 1 May. So if a farmer can’t get the crop in the field until 25 May, this amounts to about a 25 bushel per acre lost yield.
I don’t understand why Ironman used the signed values of the PDSI because too much moisture can be just as harmful as too little moisture during the growing season, and too much moisture is always a bad thing during the planting and harvesting seasons. But the Ironman model assumes the more moisture the better, and that just ain’t right. I haven’t crunched the numbers, but intuitively he might have been on firmer ground if he had used the absolute deviations from the mean PDSI so that drought and moisture were treated symmetrically.
Once again, demographics, not smoke and mirrors politics. http://www.kshb.com/news/local-news/us-census-bureau-missouri-kansas-see-slower-population-growth-than-the-united-states-as-a-whole
Not only is Kansas’ population stagnant, it is rapidly aging. That is not a recipe for either economic or job growth. It’s a long-term trend that has accelerated over the past couple of decades.
In other words, Kansas is a nice place to travel through to get to where you’re going.
then you would agree that drought is not the problem?
and demographics is certainly an issue that can be addressed by policy. or damaged by policy.
A technical question:
Is there anything wrong with regressing the error correction/ARDL equation (with lags in dependent and independent variables) and using either selecting the regression that gives the best Bayesian information criterion (or perhaps AIC–depending on whether one is aiming for the hypothetical best model or best predictor)?
i.e. regress DY(t) vs Y(t-1), X(t), dX(t), dX(t-1), dY(t-1),……
If you have just random walks or non-cointegrated stationary processes you are most likely to end up with the version that has no Y(t-1) and X(t-1) terms as your best model, but perhaps the dX(t) and other difference terms.
Even better, compute weights from the information criteria so you can assign probabilities to the different models.
I have seen cases where the underlying economics suggests that two variables should be co-integrated (typically two interest rates), someone does the ADF test on the residuals of the linear regression, and the unit root is not rejected. The result is the modeler regresses differences against differences and gets results that have an unreasonably low coefficient.