Two consecutive quarters of negative GDP growth is a commonplace rule of thumb for defining recessions, but the original conception of recessions is not captured by this simple definition. As some people have disagreed with my description (see [1]), it might be useful to review how recessions are defined in the US (with associated drawbacks), and in other economies.
The Origins of the NBER Business Cycle Chronology
The NBER business cycle chronology is typically characterized as quasi-official. The US government does not, through its statistical agencies, make pronouncments on recessions or expansions. The closest I’m aware of is then CEA Chair Greg Mankiw’s critique of the NBER’s dating of the 2001 recession to 2001, instead of 2000.
First, what’s the NBER’s original conception? Here’s Burns and Mitchell (1946), citing a slightly revised version of the 1927 definition by Wesley Mitchell:
Business cycles are a type of fluctuation found in the aggregate economic activity of nations that organize their work mainly in business enterprises: a cycle consists of expansions occurring at about the same time in many economic activities, followed by similarly general recessions, contractions, and revivals which merge into the expansion phase of the next cycle; this sequence of changes is recurrent but not periodic; in duration business cycles vary from more than one year to ten or twelve years; they are not divisible into shorter cycles of similar character with amplitudes approximating their own.
A key challenge, as the authors acknowledge, surrounds the issue what constitutes “economic activity”:
Our definition presents business cycles as a consensus among expansions in ‘many’ economic activities, followed by ‘similarly general’ recessions, contractions, and revivals. How ‘general’ these movements are, what types of activity share in them and what do not, how the consensus can differs from one cyclical phase to another, and from one business cycle to the next, can be learned only by empirical observation. And that is more than a mere matter of counting the series that rise and that fall during a given phase. … Hence, it is necessary to know precisely what each series represents and its bearing on economic activity as a whole.
Hence, the current NBER webpage on business cycles includes this explanation from the Business Cycle Dating Committee (BCDC):
The Committee does not have a fixed definition of economic activity. It examines and compares the behavior of various measures of broad activity: real GDP measured on the product and income sides, economy-wide employment, and real income. The Committee also may consider indicators that do not cover the entire economy, such as real sales and the Federal Reserve’s index of industrial production (IP). The Committee’s use of these indicators in conjunction with the broad measures recognizes the issue of double-counting of sectors included in both those indicators and the broad measures. Still, a well-defined peak or trough in real sales or IP might help to determine the overall peak or trough dates, particularly if the economy-wide indicators are in conflict or do not have well-defined peaks or troughs.
Why not GDP as a metric?
It’s a reasonable question — and indeed, it might be useful to rely on GDP. But one reason is the GDP undergoes many revisions, even in the US (advance, 2nd, 3rd, annual benchmark, and yet more revisions thereafter). Hence, the 2 consecutive quarter rule of thumb might give different answers at different times…To see this, consider GDP estimates in the midst of the recession, at the end, and the most recent vintage.
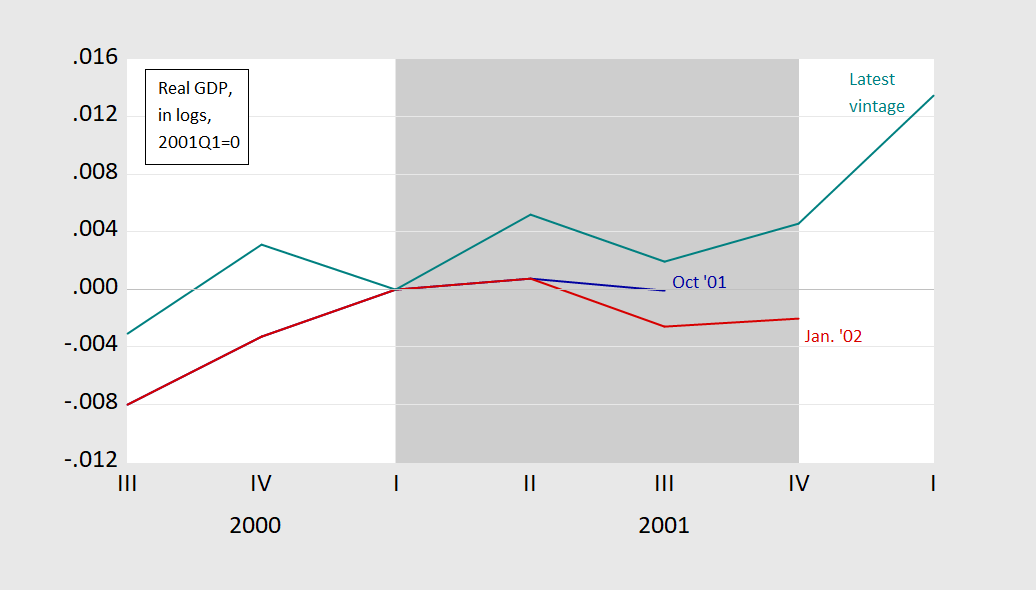
Figure 1: GDP in Ch.96$ as of Oct. ’01 (blue), as of Jan. ’01 (red), as of Aug. ’19 (teal), all in bns, SAAR. NBER defined recession dates shaded gray. Source: BEA via FRED, ALFRED, and author’s calculations.
Recession Determination for Some Other Countries
Euro area: The Centre for Economic Policy Research (CEPR), based in the UK presents its methodology here; it sounds very familiar:
The Committee defines a recession as
“a significant decline in the level of economic activity, spread across the economy of the euro area, usually visible in two or more consecutive quarters of negative growth in GDP, employment and other measures of aggregate economic activity for the euro area as a whole.”
A recession begins just after the economy reaches a peak of activity and ends when the economy reaches its trough. Between trough and peak, the economy is formally in an expansion; between peak and trough it is in a recession. In both cases, growth rates may be very low.
To reduce the chance that data revisions might lead the Committee to reconsider its choice of turning points in the future, the Committee examines a wide array of economic data in addition to GDP, such as the individual components of output and labor market data. The practice of examining the joint evolution of several key macroeconomic aggregates has been followed by the committee since its inception.
Japan: Interestingly, in one of the few cases of a government entity making pronouncements, the Economic and Social Resesarch Institute (ESRI) with in the Japanese Cabinet Office does establish a chronology. ESRI is akin to the CEA in the White House (a think tank), although it also compiles the national accounts. Like the NBER, the determination of peaks/troughs usually takes place a long time after the fact (two years in the most recent case).
United Kingdom: More common is the lead being taken up by think tanks, like CEPR. In the case of the UK, the National Institute for Economic and Social Research (NIESR) has announced the formation of a committee, akin the the NBER and CEPR, to make determinations regarding the chronology. (The research might be funded by the government, but the determinations are made at arms-length.)
Countries in General: The above list is by no means exhaustive. However, a cursory examination suggests that many analysts rely on the 2-quarter rule of thumb for conjunctural analysis, while appealing to other groups for historical chronologies. One prominent example is the Economic Cycle Research Institute, set up by Geoffrey Moore. From ECRI’s website:
In the 1960s, ECRI’s co-founder, Geoffrey H. Moore, whom The Wall Street Journal called “the father of leading indicators,” gave his original Index of Leading Economic Indicators (LEI) to the U.S. government. The state-of-art successor to the LEI is ECRI’s Weekly Leading Index (WLI).
Before there was a committee to determine U.S. business cycle dates, Moore decided all those dates on the NBER’s behalf from 1949 to 1978, and then served as the committee’s senior member until he passed away in 2000. Using the same approach, ECRI has long determined recession start and end dates for 20 other countries that are widely accepted by academics and major central banks as the definitive international business cycle chronologies. These chronologies have always been publicly available.
Hence, ECRI’s chronology has been widely used as a somewhat familiar measure of business cycles. The ECRI chronology was used in Chinn-Kucko (2015); the ECRI recession dates are shaded gray in the figure below:
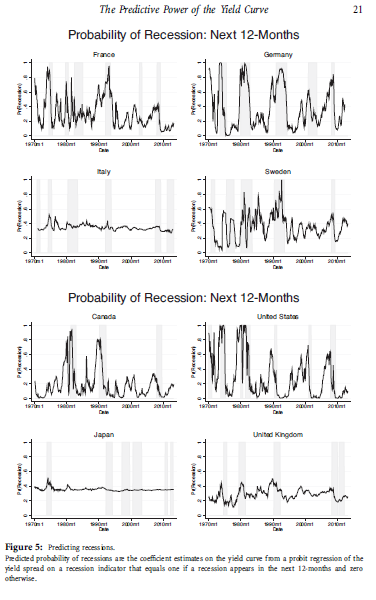
Source: Chinn-Kucko (2015).
The entire list of countries tabulated is: Canada, Mexico, Brazil, Germany, France, United, Italy, Spain, Switzerland, Sweden, Austria, Russia, Japan, China, India, Korea, Australia, Taiwan, New Zealand, and South Africa.
OECD also provides a “recession” indicator. However, it differs conceptually from the other measures mentioned above, as it’s a deviation from trend.
The OECD [Composite Leading Indicators] system is based on the “growth cycle” approach, where business cycles and turning points are measured and identified in the deviation-from-trend series. The Gross Domestic Product (GDP) is used as the reference for identification of turning points in the growth cycle for all countries, except for China for which the OECD relies on the value added of industry at 1995 prices.
Zones aggregates of the CLIs and the reference series are calculated as weighted averages of the corresponding zone member series.
The turning point detection algorithm is a simplified version of the original Bry and Boschan routine. (The routine parses local minima and maxima in the cycle series and applies censor rules to guarantee alternating peaks and troughs, as well as phase and cycle length constraints. The Bry and Boschan routine used by the OECD does not include the correction for outlier, as is the case in the original version, as such a correction is implanted at an earlier stage of the filtering process).
The components of the CLI are time series which exhibit leading relationship with the reference series (GDP) at turning points. Country CLIs are compiled by combining de-trended smoothed and normalized components. The component series for each country are selected based on various criteria such as economic significance; cyclical behaviour; data quality; timeliness and availability.
Alternatives
None of this should be taken to say the “official” or “quasi-official” determinations are the “right” ones. Moreover, it’s important to note that the NBER methodology is aimed at establishing a historical chronology, not a real-time determination. A key near real-time approach has been implemented by Jim Hamilton on the blog since 2005, and regularized in on the eve of the 2007 recession in this post — using the advance release of GDP to define high/low growth states [technical paper, Hamilton-Chauvet here]
Many other approaches to determining business cycle chronologies exist, both ex post, and in near real time. I’ll survey some of those in a forthcoming post.
My “no longer with us” Father was born in 1927, so I have to say I have some affection for that one based on the vintage year. Which one is the best definition in actuality?? I trust those with the specialized knowledge such as Menzie, Alan Blinder, Stanley Fischer, Hamilton, Gita Gopinath etc. If say 4 of 5 say “definition X” then I’m pretty much cool with that one—as long as I feel it also represents the lower socio-economic rungs of society as well—and I have not much doubt in my mind the men aforementioned will include that.
It really cannot be expressed wholly how much I LOVE this tweet:
https://twitter.com/TulsiGabbard/status/1173434704302751744
Every once in awhile when I “veer off topic”, I might even “veer” into a topic our good blog hosts take an interest in?? I believe our good man Professor Chinn has expressed some semi-interest in the economic “goings on” of Cali-for-nigh-ay??
https://www.nytimes.com/2019/09/11/business/economy/california-rent-control.html
https://www.youtube.com/watch?v=-cfc3rCQOuU
If you play that live track backwards you can hear Jimmy Page mumble “Hail Satan of Fresno”. That’s what I heard peoples had said about it anyway……..
Speaking of business cycles – McBride says he doesn’t expect a recession in the next 12 months. He did note myriad policy mistakes and the recent oil disruption that could cause a recession. He’s remaining on the bullish side for the time being. He knows more than I do, but I still think 2020 will be a bumpy ride.
Barkley Rosser complains that I’m always off topic, but all the data in this Newsweek tweet leans to the bullish side. Folks, trust me, the ENTIRE Twitter comment thread is a seminal piece of work, sure to spark orgasmic laughter.
https://twitter.com/Newsweek/status/1173982485098762240
When inflation starts to get worse the Fed tries to generate a soft landing.
About the only times that worked was the 1967 growth recession. But
because we did not have a recession in 1967 wage growth continued to rise throughout the 1960s.
I have long believed that the inflation of the 1970s began when we did not have a recession in 1967.
Architectural billings are down, per this morning’s information. Housing starts are up, but mortgage applications are down. This is a confused and confusing economy. Lots of housing starts now means more inventory when the economy turns, which will put pressure on builders in a year. If it goes as I expect. My crystal ball has been cloudy plastic in the past. I am still convinced we are going to see some kind of downturn in mid-2020. Maybe sooner if the tariff routine continues or if there’s some other crisis that comes along that requires actual adult attention.
I was alive in 1967, but was busy thinking about building forts in brier patches, not the economy. The idea that the inflation of the 1970s was touched off by a soft landing in 1967 is an interesting one. I personally have no way to analyze that idea. One thing to note is that the soft landing would have been engineered under LBJ. The Democratic Party was turfed in 1968, so whatever happened did not benefit the incumbent party. The parallel to now is that even if the fed engineers a soft landing, it may not be sufficient to get Trump reelected. Then again, the Trump phenomenon seems immune to any kind of intelligence or logic.
If we are ever to navigate the american economy
Without recessions
We’ll need reasonable now casting accuracy
The initial phase of historic cycles deserve deepee study
To help us build a real time telemetry
That can guide those running the macro instrument dash board
The choice and use
Of the various macro instruments themselves require profound public debate
Obviously the macro experts are far from consensus these days
The FED led macro management since 1979
Has shown a pronounced de facto if not de jure
bias against real wage rate growth
And bottom 2/3 household income growth
Using credit flows blew a flat in the last cycle
This long snail trail recovery and tip toe
Real wage income expansion
Suggests
We can do much better